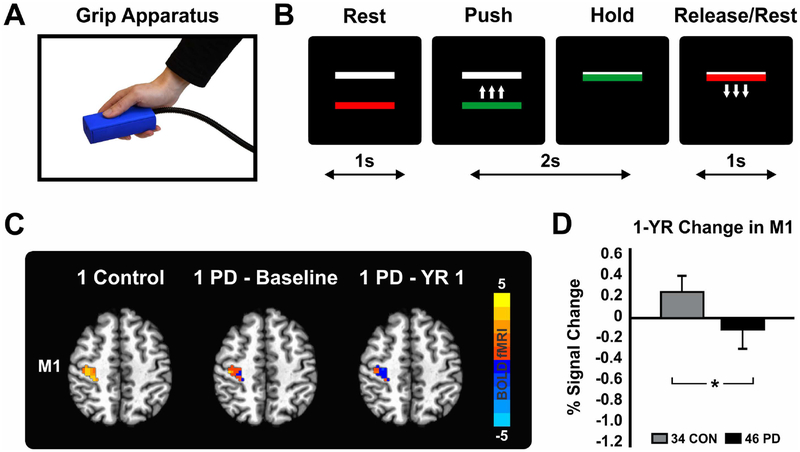
Fig. 3.
Figure adapted from Burciu RG, Chung JW, Shukla P, et al. Functional MRI of disease progression in Parkinson disease and atypical parkinsonian syndromes. Neurology 2016;87(7):709–717. (A) Grip apparatus used to produce force. PD patients performed the task with the more affected hand (B) Task consisting of a series of 2 seconds of force production and 1 second of rest. Force target was set at 15% of maximum voluntary contraction. (C) Functional MRI signal during grip force production in the contralateral M1 in one healthy control along with task-based fMRI signal at baseline and 1 year later in one PD patient. (C) Group statistics showing a reduction in force-related fMRI activity in M1 in PD over the course of 1 year. Data represents the 1-year difference adjusted for the following variables at baseline: age, sex, Montreal Cognitive Assessment Test, and percent signal change in M1. Abbreviations: CON = controls, M1 = primary motor cortex, PD = Parkinson’s disease, YR = year.

