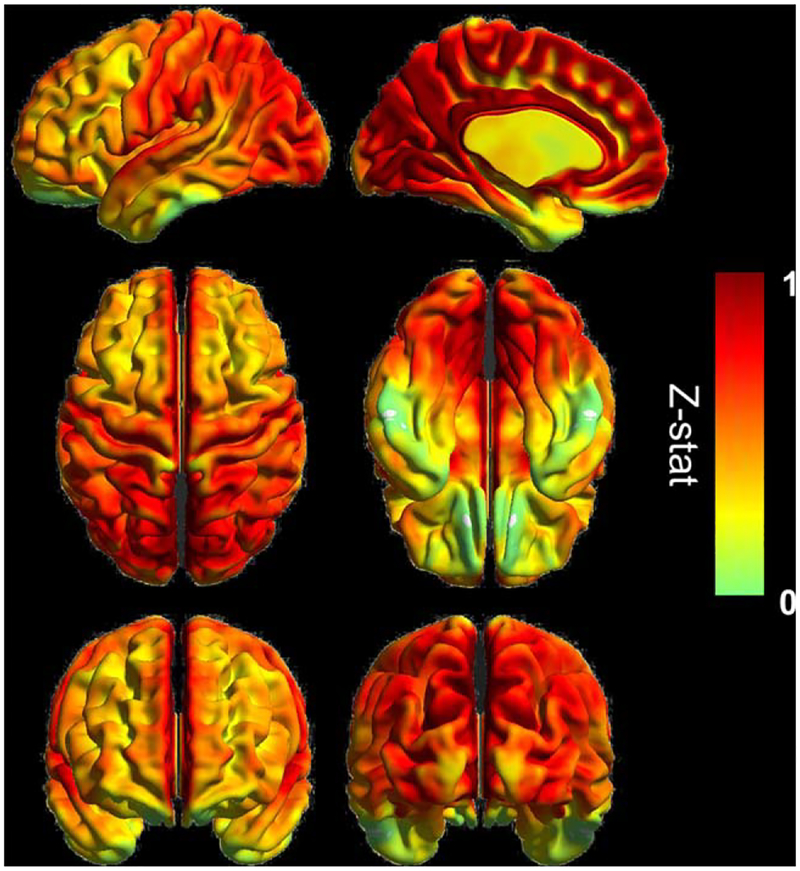
Figure 1.
Averaged VMHC map at normocapnia (N = 14), with the color bars showing the z-statistics of the measure. Surface rendering in left lateral and mid-sagittal (top row), dorsal and ventral (middle row), anterior and posterior (bottom row) views visualized by BrainNet Viewer (http://www.nitrc.org/bnv). [Color figure can be viewed in the online issue, which is available at wileyonlinelibrary.com.]

