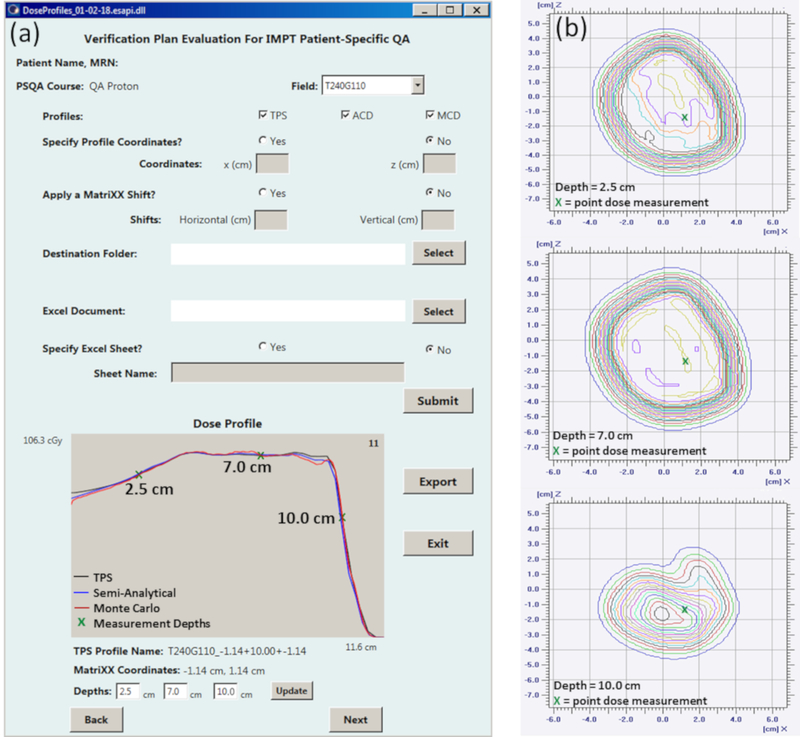
Figure 1:
(a) A gradient evaluation is performed utilizing the ESAPI script on a phantom verification field. With the GUI, the user is able to specify dose profile coordinates, or obtain suggested coordinates based on a gradient evaluation algorithm. Additional functions allow the input of lateral detector shifts and directory selection for data export. For Field T240G110 shown here, the depth dose TPS profile at x = −1.14 cm and z = −1.14 cm from phantom isocenter is suggested for measurements at depths of 2.5 cm, 7.0 cm and 10.0 cm. This profile location is propagated to the second check semi-analytical and Monte Carlo profiles for a dose comparison. (b) Point doses, extracted from the 2D array measurement, and dose at each of the selected depths along the beam path are captured for comparison against the planned dose.

