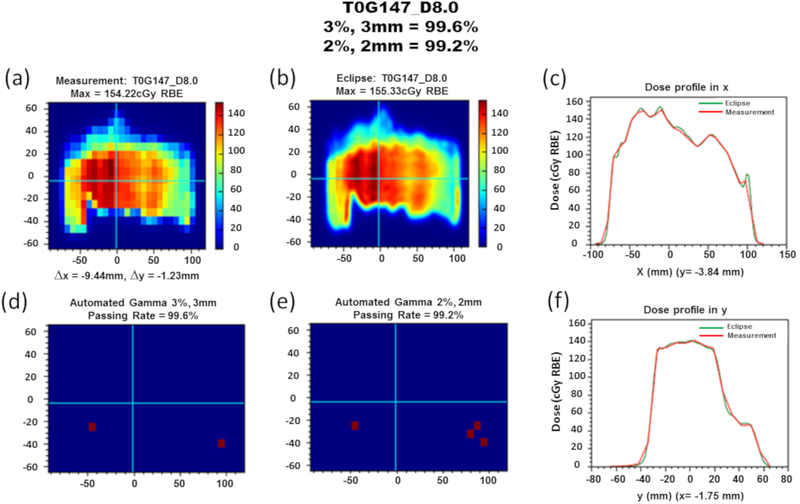
Figure 2:
Automated gamma analysis summary for field T0G147 at a depth of 8.0 cm. (a) Planar dose measurement distribution with total lateral position correction of x = −9.44 mm and y = −1.23 mm. Prior to measurements, the detector was shifted (x = 10.0 mm) to center the dose distribution, so x shifts by fitting algorithm are determined by delta of reported and detector-shifted values. (b) Planar dose distribution for the verification field at matching prescription depth. (c) Lateral dose profile along the x direction at y = −3.84 mm. (d) Automated γ-index analysis result with 3%, 3mm criteria indicating a 99.6% passing rate. (e) Automated γ-index analysis result with 2%, 2mm criteria indicating a 99.2% passing rate. (f) Lateral dose profile along the y direction at x = −1.75 mm.

