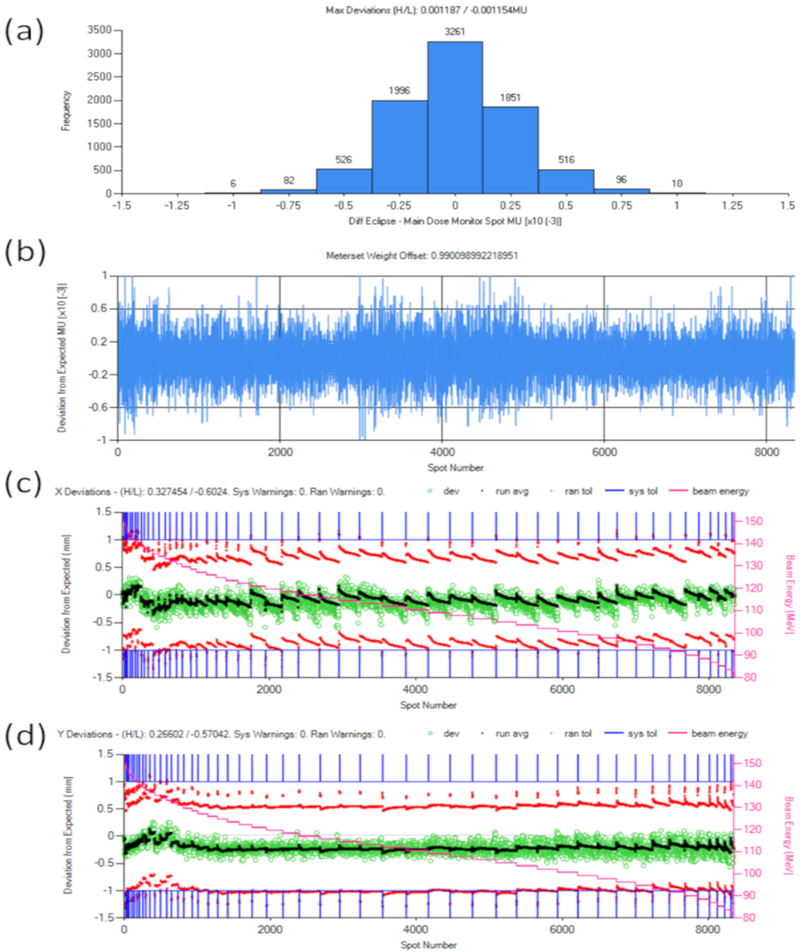
Figure A1:
Log file analysis summary of a treatment field comparing the delivered spot MU and position to the planned version. (a) Histogram of spot MU deviations; (b) per spot MU deviation; (c) the per-spot position (green circles) and average (black dots) deviation in the horizontal aspect of the beams eye view, with systematic error tolerances represented by blue lines, random error tolerances represented by red points, and beam energy indicated by pink stair step and secondary vertical axis values; and (d) similar to (c) except showing the per spot position deviations in the vertical aspect of the beams eye view.

