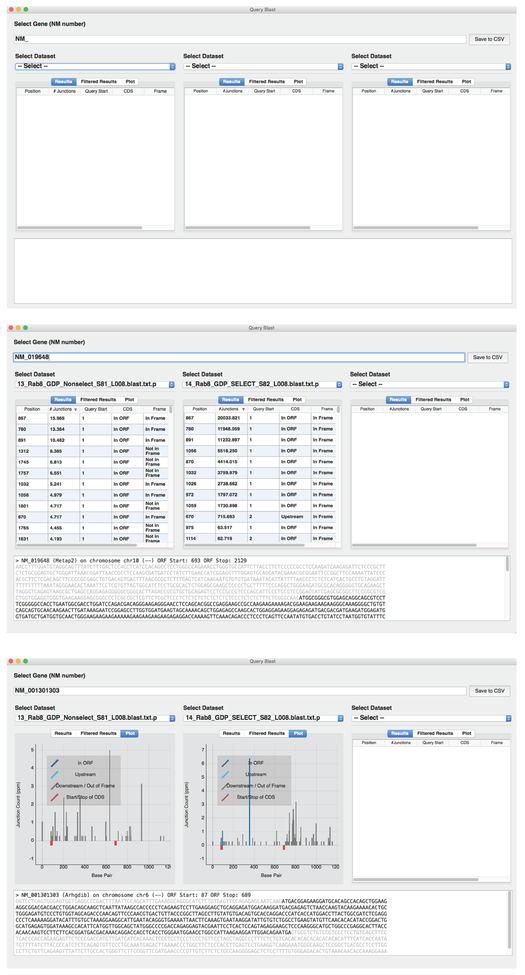
Figure 6: Display of Blast_Query.
Output of Blast_Query from 3 different views. Top is the initial view of Stat_Maker before the datasets of candidate are selected. The middle panel is an example view of the data table displaying information on a given candidate for two different datasets. Bottom shows a graphic view of the tabular data, plotting the number of particular junction points along the gene/cDNA of interest.

