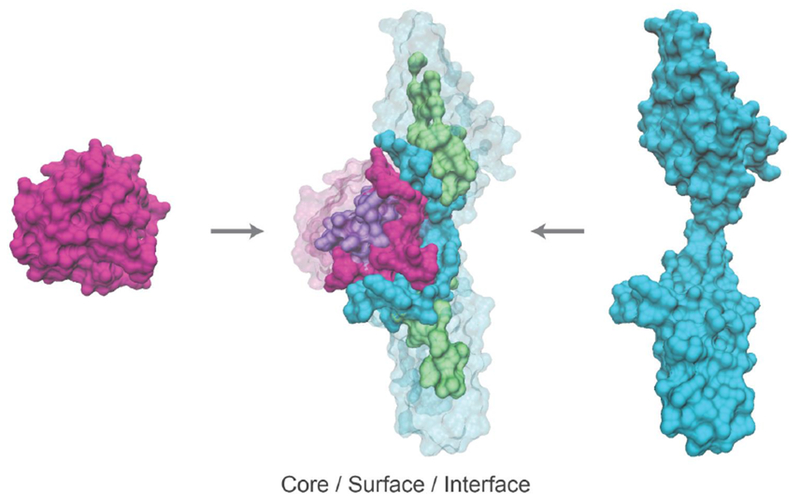
Figure 4. Mapping amino acid position to potential to interfere with protein interactions.

Protein structures of FGF2 and FGFR1 are shown on the left and right respectively, and as a complex in the center (Protein Data Bank structure ID: 1CVS). In the complex, residues are colored according to location in the protein core (purple and green), at the interface (pink and blue) or at the surface outside of the interface (transparent pink and blue) on the two proteins respectively.
