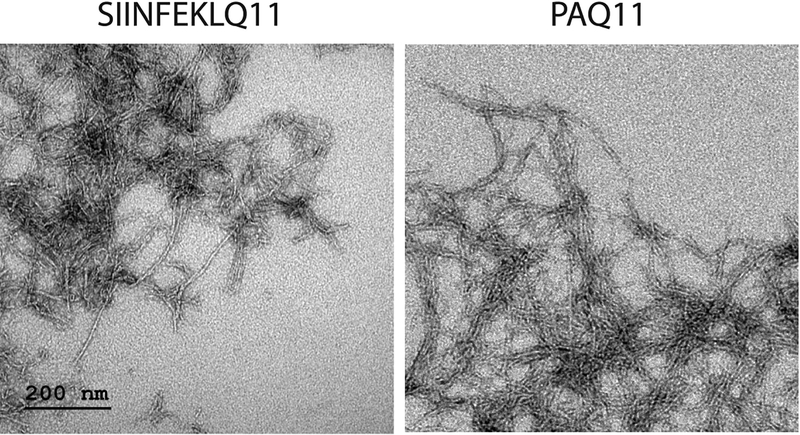
Figure 1. Negative-stained TEM illustrating fiber morphology.
Shown are nanofibers composed of 2 mM total peptide containing 1.33 mM epitope-bearing peptide (SIINFEKLQ11 or PAQ11, as indicated) and 0.67 mM Q11 (a 2:1 ratio). Nanofibers were diluted to 0.2 mM in PBS immediately prior to application onto grids for viewing by TEM. Scale bar applies to both panels.

