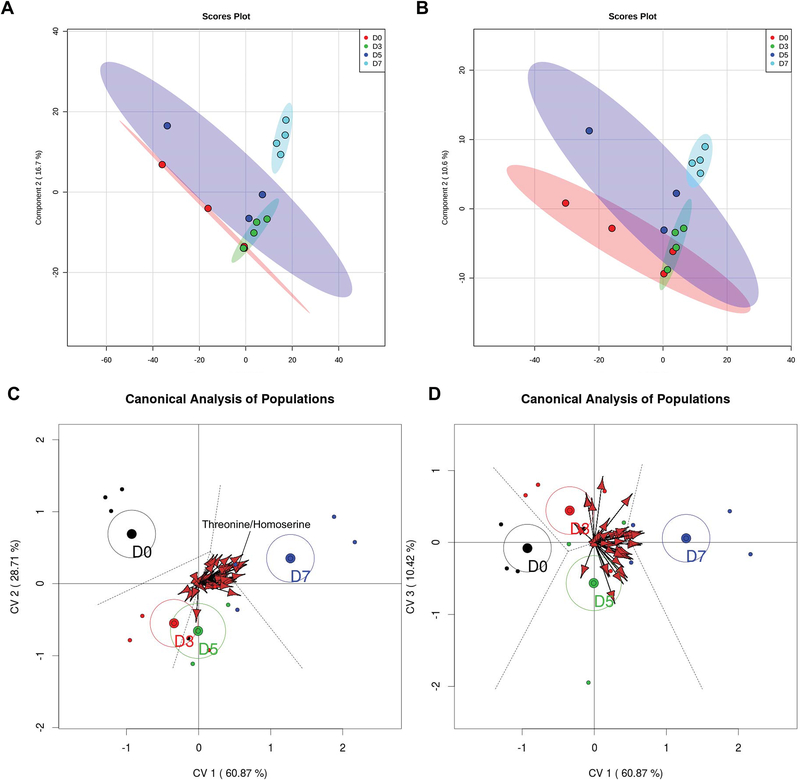
FIGURE 2.
Partial least-squares discriminant analysis (PLS-DA). Panels A and B represent the PLS-DA of the positive (A) and negative (B) data sets including all features while panels C and D are biplot representations of a canonical analysis of populations from merged positive and negative data sets. Panel C represents the relationship between canonical variables 1 and 2. Panel D represents the relationship between canonical variables 2 and 3. Vectors represent statistically significant (p < 0.05) features across days relatives to ovulation. The vectors point towards the day in which intensity of the feature increases and length of the vector reflects the magnitude of variance explained by that feature. One vector, for threonine/homoserine, is labeled for illustrative purposes.

