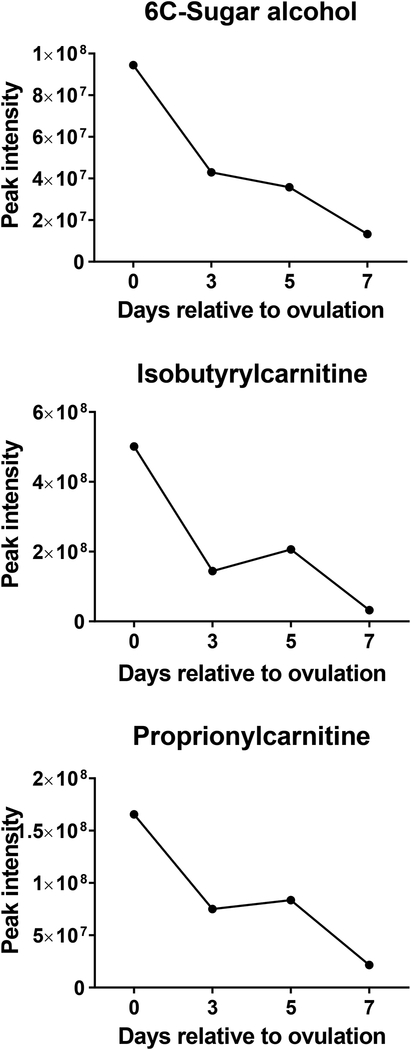
FIGURE 3.
Changes in concentration during the first 7 days after ovulation for molecules where the intensity decreased from day 0 to day 7 relative to ovulation (P<0.05). Data are least-squares means. P values for linear, quadratic and cubic effects of day and the SEM are reported in Table S4 (Supplementary Material).

