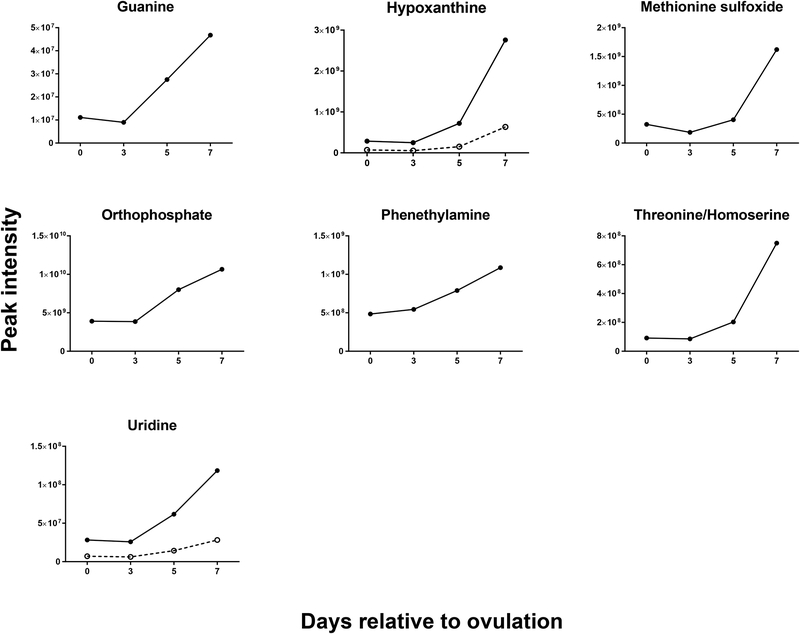
FIGURE 4.
Changes in concentration during the first 7 days after ovulation for molecules where the intensity was similar at day 0 and day 3 but then increased from day 3 to day 7 relative to ovulation (P<0.05). Metabolites with more than one feature are indicated by two lines. The cell icon placed within individual graphs indicate that the metabolite has been reported to activate one or more cellular signaling pathways. Data are least-squares means. P values for linear, quadratic and cubic effects of day and the SEM are reported in Table S4 (Supplementary Material).

