
Figure. Risk-Adjusted Differential Trends in Readmission Rates Between Discharges of White and Black Patients Between 2007-2015 for Discharges by Safety-Net Hospital Status and Clinical Condition.
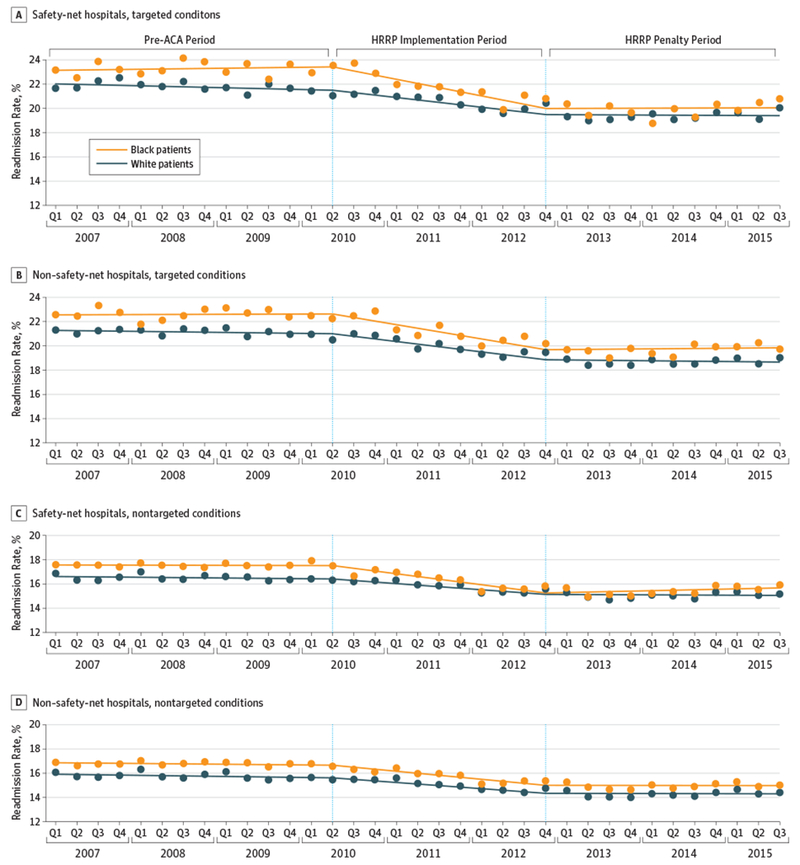
The pre-Affordable Care Act (ACA) period began on January 1, 2007, and ended on March 31, 2010. The Hospital Readmissions Reduction Program (HRRP) implementation period began on April 1, 2010, and ended on September 30, 2012. The HRRP penalty period began on October 1, 2012, and ended on September 30, 2015. Risk-adjusted readmission rates were calculated using a linear regression model containing the interaction between race and quarter and the “predict” postestimation command for each quarter. All models were adjusted for patient characteristics at discharge(ie, age, sex, 30 comorbidities defined by Medicare’s hospital readmission risk adjustment, and Medicare and Medicaid dual-eligible status), hospital characteristics (ie, number of beds, profit status, teaching hospital status [as indicated by having an allopathic or osteopathic residency program], rural location of hospital, and US Census-designated region), and incorporated hospital fixed effects. Trends in risk-adjusted readmission rates were calculated using a linear spline regression model for the 4 combinations of safety-net status and clinical condition. Recycled predictions were used with the “predict” postestimation command in Stata after each regression to estimate trends in readmission rates by race within each period: the pre-ACA period, the HRRP implementation period, and the HRRP penalty period. These models were adjusted for patient characteristics at discharge, hospital characteristics, and incorporated hospital fixed effects. Q indicates quarter.