Figure 1.
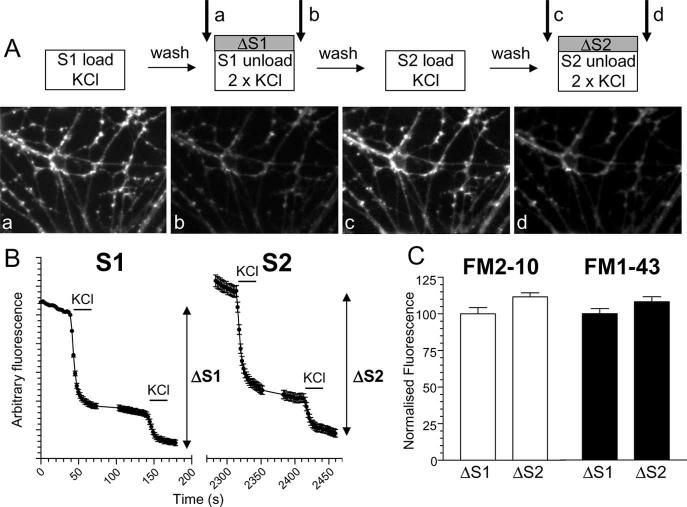
S2/S1 protocol for investigating SV endocytosis. A, Granule neuron cultures were loaded and unloaded with FM dyes using the protocol displayed. In both S1 and S2, dyes were loaded for 2 min with 50 mm KCl and then immediately washed away. Unloading was stimulated by two sequential 30 s stimuli of 50 mm KCl. a–d, Representative images of cultures either loaded at S1 (a), unloaded at S1 (b), loaded at S2 (c), or unloaded at S2 (d). Arrows in A indicate the time points at which images were acquired. B, Representative trace showing the average unloading response from 90 nerve terminals in one experiment using FM2–10 during both S1 and S2. Bars indicate addition of KCl. The extent of SV turnover is estimated from the total amount of dye unloading at S1 (ΔS1) and S2 (ΔS2). Error bars indicate SEM. C, The amount of dye unloading at ΔS1 (control) and ΔS2 (test) in the absence of any perturbation of the system is approximately equal for both FM2–10 (open bars ± SEM; n = 233) and FM1–43 (solid bars ± SEM; n = 258). Fluorescence change normalized to ΔS1 for both FM2–10 and FM1–43.

