

Abstract
Background
Gonorrhoea is an important cause of sexual ill-health and is concentrated in geographic areas and demographic groups. This study explores the distribution of gonorrhoea across London.
Methods
Epidemiological data on all gonorrhoea cases were collected from 13 major genitourinary clinics in London between 1st June and 30th November 2004. Samples were stored centrally and typed using NG-MAST. The postcode of each case’s main residence was used to calculate incidence of gonorrhoea by borough using data from the UK 2001 census and a population survey on residence of men who have sex with men (MSM).
Results
In total 2891 cases were confirmed, 1822 of which had postcode data, resided in London and had their strain successfully typed. There was a very high incidence of gonorrhoea in MSM (1834 per 100,000 population) and heterosexuals of black ethnicity (392 per 100,000). The incidence amongst heterosexuals was highest in: City of London (390 per 100,000, 95% CI 213-566), Southwark (308 per 100,000, 95% CI 280-336), Hackney (284 per 100,000, 95% CI 254-313) and Lambeth (216 per 100,000, 95% CI 194-239) and was not associated with measures of social deprivation (correlation coefficient=0.0008, p=0.97) but was strongly associated with black ethnicity (correlation coefficient=0.48, p=0.01). Forty-five percent of cases had one of the 21 major strains; eight of these strains were significantly clustered geographically and persisted for a shorter duration than those that were not clustered. Patients travelled a mean of 7.7 km from their home to the clinic.
Conclusions
High gonorrhoea incidence in London is observed in MSM and heterosexuals of black ethnicity. Endemic strains in both MSM and heterosexuals are diagnosed at multiple clinics. Interventions, including partner notification, must therefore operate between clinics.
Key Messages
A high incidence of gonorrhoea in London occurs in men who have sex with men and in heterosexuals of black ethnicity
Analysis of incidence by district did not show any correlation between incidence and measures of social deprivation
On average, patients travel a substantial distance to access care and hence interventions need to be coordinated across multiple clinics
Introduction
After two decades of decline in England, numbers of gonorrhoea cases began to rise again from a low of 11,888 in 1997 to a peak of 24,357 cases in 2002, falling again to 17,880 in 20051. Gonorrhoea is unevenly distributed, and is very common in certain geographical areas and demographic groups (UK collaborative group). The highest incidence of gonorrhoea in the UK is seen in London with 103.5 cases per 100,000 population in 2004 falling to 90.1 in 20051. The recent decline has been predominantly in heterosexual men and women, with a continuing increase in men who have sex with men (MSM). Variation in incidence by ethnic group has also been reported with a significantly higher incidence in those from Black Caribbean and Black African ethnic backgrounds2-5.
Currently treatment of gonorrhoea in London is provided through a network of specialized genitourinary clinics (32 in total) that patients can access directly and which are free at the point of care. Gonorrhoea control is led by health advisors and focuses on partner notification, which is usually carried out though patient referral, rather than provider referral and active contact tracing. Health advisors sometimes liaise between clinics when a contact has attended, but this is inconsistent, leading to a high proportion of cases where there is no record of whether partners have been treated.
In a city such as London, with multiple open access clinics, the lack of coordinated partner notification means that there is little understanding of linked networks of gonorrhoea cases, and we therefore undertook an evaluation of molecular typing across London over a 6 month period. Using NG-MAST, which has been shown to be a highly discriminatory typing procedure, we identified several large strain clusters (individuals infected with the same strain) which based on the age, sexual orientation and ethnicity of the patients, appear to represent endemic transmission networks6. These results suggest that additional use of molecular typing methods could prove useful in improving control of gonorrhoea in London.
In this paper we explore the geographic distribution of gonorrhoea across London and its relationship with sexual orientation, ethnicity and social deprivation. Furthermore, we focus on the extent to which local endemic transmission, as identified through the molecular typing and geographic clustering of cases, can be identified and controlled through the current network of genitourinary clinics.
Methods
Gonorrhoea Cases
Detailed methods for typing and basic data collection have been reported previously6. Briefly, as part of the Gonococcal Resistance to Antimicrobials Surveillance Programme (GRASP), we obtained isolates of Neisseria gonorrhoeae diagnosed in 13 major genitourinary clinics in London between 1st June and 30th November 2004. These clinics all provide a free service and account for approximately 80% of all gonorrhoea cases diagnosed in London. Isolation and identification of gonorrhoea was performed at each clinic and one isolate from each patient sent to a central laboratory for further characterisation. Each isolate was further characterised using NG-MAST7 and assigned a single strain identifier based on its nucleotide sequence at two polymorphic loci (por and tbpB).
Patient data were collected on standardised forms from clinic case notes. Information retrieved included sex, self-reported sexual orientation, age, self-reported ethnicity (using standard categories), symptoms at this episode, site of infection, past history of gonorrhoea, concurrent STIs and numbers of partners in the past 3 months within the UK and overseas. The data form was designed to collect the first four or five digits of the postcode of the patients home address, defining geographical location at the sector level (approximately 2,500 households per sector). However, for many patients the postcode was only recorded in the notes at the district level (first 3 or 4 digits, approximately 8,000 households per district) and hence all data were restricted to this level in the analyses.
Analysis of Incidence
Population data for Greater London by sex, age, ethnicity and geographical location were obtained from the 2001 Census8. The population at risk was defined as those aged between 16 and 59 years. Due to the large overlap between district postcodes and census wards, we were not able to match the gonorrhoea cases at this level. We therefore calculated incidence at the census district level (for London this is identical to the borough). Each postcode district (defined by the first half of the postcode) was assigned to the census district in which the majority of its postcode lay. As only a small number of patients reported more than one episode over the 6 month period, the crude incidence was based on episodes rather than individuals. These were adjusted upwards to account for the proportion of cases for whom epidemiological, microbiological and postcode data were available. We did not further adjust incidence to account for the approximately 20% of cases treated at clinics not included in our study since it is not possible to estimate how this percentage varies by district.
We excluded the six districts (Barking and Dagenham, Havering, Hillingdon, Kingston-upon-Thames, Richmond-upon-Thames and Sutton) where less than 5 cases were reported.
Incidence rates were estimated by district separately for the heterosexual cases and those cases identified as men who have sex with men (MSM). The proportion of the male population that are MSM was assumed to be 5.5% overall, based on the number of men in London reporting sex with another man in the last five years9. The MSM and heterosexual populations were then estimated using the total population aged 16 to 59 from the census data. Estimates of the population of MSM by district were obtained from the National 2004 Vital Statistics Gay Men’s Sex Survey which included data on 3956 men resident in London10 and were subtracted from the total population to obtain estimates of the heterosexual population by district.
The heterosexual incidence by census district was compared to the ethnic breakdown of the district. For both the gonorrhoea cases and the population at risk, black ethnicity was defined as Black Caribbean, Black African or Black Other. White ethnicity was defined as White British, White Irish or White Other. All other ethnic groups (including Indian, Pakistani, Bangladeshi, Chinese and those of mixed ethnicity) were coded as “Other” ethnic group. Self-reported ethnicity data for the MSM population was obtained from the National 2004 Vital Statistics Gay Men’s Sex Survey10. However, as the majority of MSM gonorrhoea cases were of white ethnicity we did not attempt to analyse this further.
Heterosexual and MSM incidence was also compared to the Townsend score of social deprivation11. This score was used to rank the districts within London based on a combination of house ownership, car ownership, over-crowding and unemployment. To assess the major determinants of overall incidence, we also undertook a multivariate analysis to explore the importance of the proportion of the population that were MSM, the proportion of the population of black ethnicity and the Townsend score of deprivation.
Statistical Analyses
The incidence by district was compared to that expected under a homogeneous Poisson process using chi-squared goodness-of-fit statistic to test for any significant deviations. Pearsons correlation coefficients were calculated to test for correlations between ethnicity, deprivation, proportion of the population that were MSM and incidence. Linear regression was performed on log transformed incidence to identify the main determinants of overall incidence. The non-parametric Kruskal-Wallis test was used to test for differences in the number of sexual partners reported in the 3 months prior to diagnosis between ethnic groups. For each of 21 major strains identified in the data, we also tested whether the cases were geographically clustered. SatScan, which uses a likelihood based approach to test for deviations from a homogeneous Poisson process, was used to identify statistically significant clusters12. We compared the mean number of days that the strains persisted in those strains that were significantly geographically clustered to those that were not using a non-paired t-test.
Results
Over the six month period a total of 2891 cases were reported. We were able to retrieve and characterise the isolate and match the epidemiological data to 2,045 (71%) of these cases. Of these, 1871 (92%) had recorded postcode data. Forty-nine of these cases resided outside of Greater London and are therefore excluded from our analysis, leaving a total of 1822 cases and an inclusion rate of 64% (1822/(2891-49). Of these, 439 were women, 658 heterosexual males, 682 MSM and 43 men of unknown sexual orientation. Ten cases (5 in MSM, 5 in heterosexuals) resided in the five districts with low numbers of cases and hence were excluded from our incidence calculations.
We observed an overall incidence of 146 per 100,000 population (95% CI 140-152). This is slightly higher than that reported by the HPA for the same period and this difference is most likely due to the different denominators used to calculate incidence (we used population aged 16 to 59 whereas the HPA figure use a population denominator of all aged 13 and above). The highest incidence of gonorrhoea was observed in MSM (1834 per 100,000 population, 95% CI 1724-1944) with an overall incidence that was 20 times higher that in the heterosexual population (90 per 100,000 population, 95% CI 86-94). However, the estimates of incidence in MSM should be interpreted with caution given the uncertainty in the estimate of the total size of the MSM population.
The incidence of gonorrhoea amongst heterosexuals differed substantially between areas (p<0.0001) with the highest rates recorded in the City of London (390 per 100,000, 95% CI 213-566), Southwark (308 per 100,000, 95% CI 280-336), Hackney (284 per 100,000, 95% CI 254-313) and Lambeth (216 per 100,000, 95% CI 194-239) (Figure 1a). The incidence in the City of London appears to be an outlier and is uncertain due to the small population recorded in this area. It is also possible a small number of patients have reported their work address rather than their home address. Using estimates of the MSM population in London, we observe less, although still significant, geographical clustering of MSM cases (Figure 1b).
Figure 1.
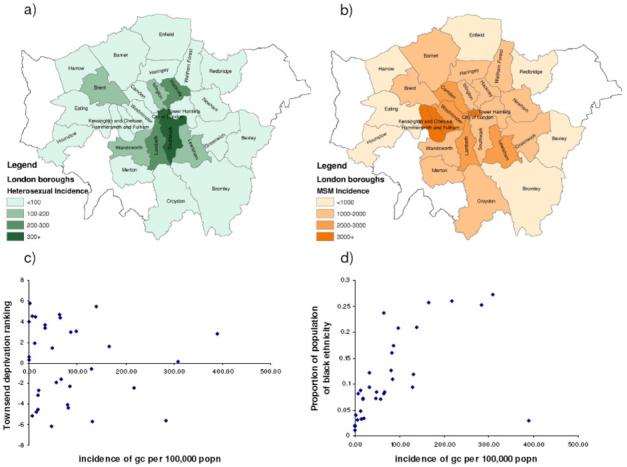
Incidence of gonorrhoea over the 6 month period by census district. a) Incidence of cases in heterosexuals as proportion of total heterosexual population; b) Incidence of cases in MSM using estimated number of MSM as population at risk; c) Relationship between incidence of cases in heterosexuals and Townsend’s rank measure of social deprivation. d) Relationship between incidence of cases in heterosexuals and the proportion of the population aged 16 to 59 of black ethnicity. For c) and d) each point in the figure represents an estimate of incidence in a district. The outlier with high incidence and low social deprivation in part c) is the City of London.
Although the incidence of gonorrhoea amongst heterosexuals is highest in boroughs known to be socially deprived, there was little overall correlation between the Townsend ranking of social deprivation and the incidence in either the overall population or the heterosexual population at district level (correlation coefficient r=0.0008, p=0.97) (Figure 1c). In contrast, there was a strong correlation between the proportion of the population reported to be of black ethnicity and the heterosexual incidence of gonorrhoea (correlation coefficient r=0.48, p=0.01) (Figure 1d). This suggests that geographical variation in gonorrhoea incidence amongst heterosexuals is predominantly due to variation in ethnic groups by area. Our results from an ecological analysis of the factors determining high overall incidence at a district level confirmed this, with black ethnicity (p=0.0004) and the proportion of the population reported to be MSM (p<0.0001) both significantly associated with an increased incidence whereas the Townsend score of deprivation showed no correlation with incidence (p=0.88).
Incidence rates across London amongst those of black ethnicity were strikingly high, as has previously been reported in South London3. Amongst heterosexuals, the incidence of gonorrhoea was 392 per 100,000 per year in those of black ethnicity (95% CI 385-399) compared to 24 per 100,000 per year in those of white ethnicity (95% CI 22-26, rate ratio (RR) of 16.3), and 32 per 100,000 per year (95% CI 28-36, RR 12.3) in those of other ethnicity. No differences were observed between ethnic groups in the numbers of partners reported in the three months preceeding diagnosis (chi-squared=3.4, p=0.17).
Amongst the overall sample, 21 frequent strains were observed in 849 cases, accounting for 47% of all cases.Seven of these strains were predominantly recovered from MSM and the remaining 14 predominantly from heterosexuals. In the MSM strains there were no significant differences between the clusters by age or ethnicity. Amongst the heterosexual clusters there were significant differences by age and ethnicity with strains 19, 33 and 615 predominantly occurring in those under 25 years of age and strains 8, 25, 374 and 615 occuring predominantly in those of black ethnicity (75% or more). Further analysis of these characteristics has previously been reported and appears to represent ongoing endemic transmission in London6. Here we therefore explored the extent to which these endemic strains are transmitted within localised areas.
Table 1 shows the results from the SatScan tests for spatial clustering. Of the 21 major strain clusters, eight were significantly clustered geographically. Of these, three were centred in South London in one of the areas of highest incidence (ST8, ST615 in Lambeth/Southwark), one was divided between South and East London (ST387), one was located in central and West London (147), two were in West London (374 and 359), and one was a very local cluster in North East London (619) (Figure 2). All six clustered heterosexual strains were predominantly from individuals of black ethnicity whilst 4 of the 6 strains were predominantly in those under 25 years of age (Table 1). The strains from predominantly MSM individuals (359 and 147) were located in Western and Central areas. The eight strains that were locally clustered persisted for a mean of 160 days within the 6-month study period which was significantly shorter than the duration that non-clustered strains were observed (mean 171 days) (p=0.04).
Table 1.
Summary of the 14 large strain clusters and their geographical location. Chi-squared statistic and p-value refer to the SatScan test for spatial homogeneity of strains.
| ST | Number | % MSM | % under 25 years | % black ethnicity | Number of days between first and last occurrence | Number of clinics reporting ST | Districts Reported In | Test for geographical clustering | |
|---|---|---|---|---|---|---|---|---|---|
| Log likelihood ratio | P-Value | ||||||||
| MSM: | |||||||||
| 40 | 61 | 88.5 | 16.4 | 4.9 | 176 | 12 | Bexley, Camden, Ealing, Greenwich, Hackney, Haringey, Lambeth, Lewisham, Kensington and Chelsea, Redbridge, Southwark, Westminster, Wandsworth. | 6.07 | 0.216 |
| 64 | 46 | 78.2 | 17.4 | 15.2 | 179 | 11 | Barnet, Camden, Croydon, Greenwich, Hackney, Haringey, Kensington and Chelsea, Lambeth, Southwark. | 5.95 | 0.187 |
| 147 | 45 | 86.7 | 15.6 | 20 | 167 | 10 | Ealing, Hackney, Haringey, Kensington and Chelsea, Lambeth, Lewisham, Southwark, Westminster, Waltham Forest. | 9.39 | 0.016 |
| 210 | 72 | 88.9 | 13.9 | 5.6 | 176 | 11 | Barnet, Camden, Croydon, Ealing, Greenwich, Hackney, Haringey, Hillingdon, Kensington and Chelsea, Lambeth, Lewisham, Merton, Southwark, Waltham Forest. | 5.14 | 0.414 |
| 225 | 112 | 92 | 24.1 | 6.3 | 175 | 12 | Barnet, Bexley, Camden, Ealing, Enfield, Greenwich, Hackney, Kensington and Chelsea, Lambeth, Lewisham, Southwark, Waltham Forest, Westminster. | 4.61 | 0.544 |
| 359 | 24 | 79.2 | 33.3 | 4.2 | 144 | 8 | Camden, Hackney, Lambeth, | 8.98 | 0.023 |
| 547 | 21 | 85.7 | 14.3 | 23.8 | 161 | 9 | Camden, Kensington and Chelsea, Lewisham, Westminster. | 4.37 | 0.499 |
| Het: | |||||||||
| 2 | 90 | 6.7 | 57.8 | 56.7 | 182 | 13 | Bromley, Camden, Croydon, Ealing, Enfield, Greenwich, Hackney, Haringey, Kensington and Chelsea, Lambeth, Lewisham, Southwark. | 6.18 | 0.195 |
| 6 | 23 | 0 | 52.2 | 73.9 | 136 | 7 | Greenwich, Lewisham, Merton, Southwark. | 6.35 | 0.136 |
| 8 | 32 | 0 | 50 | 78.1 | 176 | 7 | Camden, Greenwich, Lambeth, Lewisham, Westminster, | 12.25 | 0.002 |
| 19 | 30 | 0 | 85 | 65 | 178 | 9 | Haringey, Lewisham, Newham, Southwark. | 5.18 | 0.321 |
| 25 | 33 | 3 | 63.6 | 78.8 | 180 | 8 | Greenwich, Hackney, Lambeth, Lewisham, Newham, Wandsworth, Westminster. | 7.65 | 0.051 |
| 33 | 19 | 0 | 94.8 | 63.2 | 163 | 11 | Bexley, Hackney, Lewisham. | 5.27 | 0.275 |
| 51 | 56 | 1.8 | 66.1 | 67.9 | 175 | 10 | Barnet, Camden, Croydon, Ealing, Greenwich,Hackney, Haringey, Kensington and Chelsea, Lambeth, Lewisham, Southwark, Westminster. | 6.45 | 0.166 |
| 224 | 37 | 0 | 75.7 | 67.6 | 171 | 7 | Hackney, Lambeth, Lewisham, Kensington and Chelsea, Southwark, Waltham Forest. | 7.15 | 0.073 |
| 356 | 33 | 0 | 63.6 | 60.6 | 179 | 11 | Camden, Croydon, Hackney, Lambeth, Lewisham, Southwark, Waltham Forest. | 7.07 | 0.085 |
| 367 | 24 | 0 | 12.5 | 62.5 | 153 | 7 | Croydon, Kensington and Chelsea, Lambeth, Lewisham. | 10.02 | 0.005 |
| 374 | 18 | 0 | 66.7 | 77.8 | 147 | 4 | Camden, Croydon, Hounslow. | 9.46 | 0.005 |
| 387 | 37 | 0 | 73 | 70.3 | 163 | 6 | Barnet, Croydon, Hackney, Haringey, Kensington and Chelsea, Lambeth, Lewisham. | 9.14 | 0.016 |
| 615 | 21 | 0 | 95.2 | 81 | 163 | 3 | Greenwich, Lewisham, Lambeth. | 17.24 | 0.001 |
| 619 | 25 | 4 | 56 | 68 | 163 | 8 | Hackney, Haringey, Kensington and Chelsea, Merton, Waltham Forest. | 8.92 | 0.013 |
Figure 2.
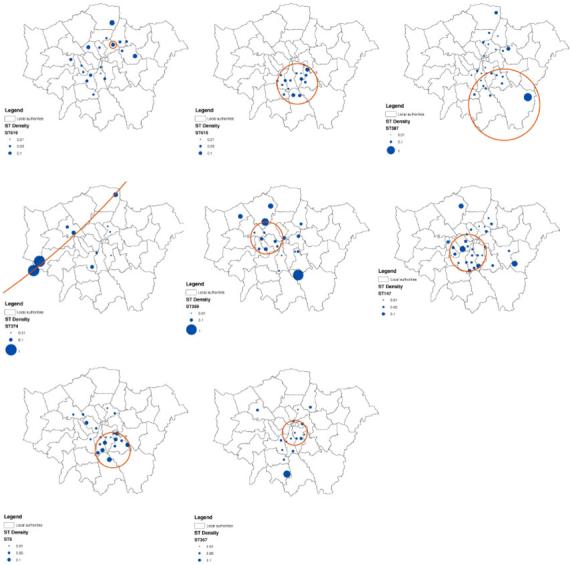
The location and size of the eight heterosexual-associated strains identified as being geographically clustered. The size of the filled blue circles is relative to the proportion of the total cases in the post code district (e.g. W2) which were of that sequence type. The orange circles represent the boundary of the significant spatial cluster located by the likelihood clustering routine.
Although the genitourinary clinics are located across the capital, we observed no clustering of strains by clinic. Each of the endemic strains was reported at three or more clinics (Table 1). Patients travelled a mean of 7.7 km from their home to the clinic. Those attending clinics located in Central London travelled a significantly greater distance than those attending clinics further from the centre (Figure 3), suggesting that the Central London clinics have a wider and less localised patient catchment population. Four relatively central clinics deviated from this trend - Kings, Homerton, Whittington and Royal Free. The former three are located in areas with high incidence amongst heterosexuals and tend to see patients from within this local area. The latter clinic sees a high proportion of MSM (63% of cases).
Figure 3.
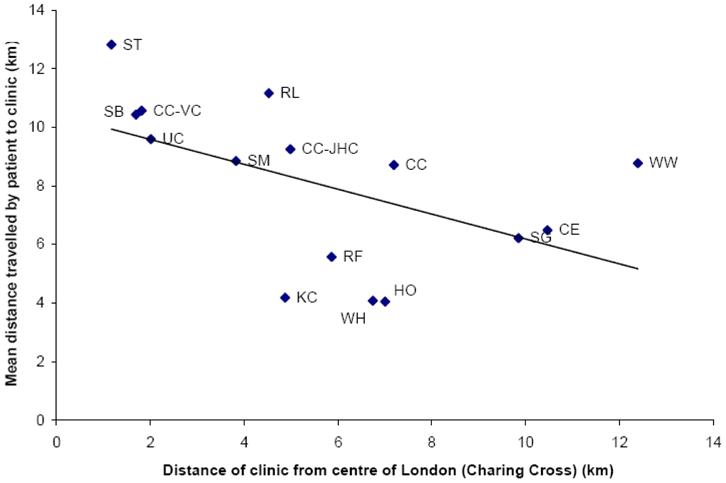
The mean distance travelled by gonorrhoea patients to each of the clinics plotted against the distance of the clinic from Central London (Charing Cross). CC=Charing Cross, CC-JHC=John Hunter Clinic, CC-VC=South Westminster Centre, CE=Central Middlesex, HO=Homerton, KC=Kings College, RF=Royal Free, RL=Royal London, SB=St Bartholomew’s, SG=St Georges, SM=St Mary’s, ST=St Thomas’s, UC=Mortimer Market, University College London Hospital, WH=Whittington, WW=Woolwich.
Discussion
Gonorrhoea in London is geographically clustered with some areas, notably inner city boroughs in South and East London, experiencing very high incidence rates. This geographical clustering is particularly apparent amongst heterosexual men and women. Unlike similar studies in the US13-16, this geographical clustering of cases does not relate strongly to measures of social deprivation but reflects the ethnic makeup of the different areas of London. Those areas with a high proportion of people of Black African or Black Caribbean ethnicity experience the highest incidence of gonorrhoea. In particular, areas in South London, as previously reported,6 as well as areas in East London appear to be at high risk. This is reflected in the 16-fold increase in incidence amongst heterosexuals of Black ethnicity compared to heterosexuals of White ethnicity. There was an even greater risk of gonorrhoea in MSM, with a rate five-fold higher than in heterosexuals of black ethnicity, although estimates are less secure for MSM due to denominator uncertainty.
The spatial distribution of different strains of N. gonorrhoeae shows a wide dispersal of the most common strains. However, 8 of the 21 predominant strains were geographically clustered in areas of high incidence (South and East London) and these strains appeared to persist for a shorter time than those that were less geographically clustered although the magnitude of this difference was not large. If these strain clusters do indeed represent endemic transmission, this has important consequences for control as interventions, particularly partner notification and contact tracing, must be undertaken across London rather than restricted to local areas. Our results show that these major strains are also present in multiple clinics, with the larger clinics recording cases with all of these strains. Furthermore, although most clinics outside the central areas of London predominantly treat patients from within a local area, the mean distance travelled for treatment remains high. With many different potential clinics providing care, cases from within a local transmission network are also unlikely to appear exclusively at a single clinic. Fewer of the strains predominantly found in MSM were clustered spatially suggesting that MSM may be less likely to acquire infections locally.
The main limitation of our study is the incomplete coverage of gonorrhoea cases. Our study sites report approximately 80% of all cases in London and the others are missing. Although we excluded some areas due to small numbers of cases, we may have under-estimated the incidence in some of the included areas. In addition, in our final sample only approximately 65% of diagnosed cases were included. The majority of those excluded were due to early problems in culturing the bacteria from samples and therefore are unlikely to have introduced systematic biases in the demographic or behavioural characteristics of the population. However, as there were differences between clinics in the success of storage of the samples, it is possible that this again could bias estimates of incidence in some locations. A second limitation is that it was not possible to collect full postcode details. The allocation of cases to census districts was therefore difficult and it is possible that some misclassification has occurred on the boundaries of the districts. The study was also limited by the lack of accurate denominator estimates for MSM populations at local level.
The study shows that while molecular typing may help identify linked clusters, for this to inform control by breaking transmission chains of endemic disease, interventions will need to be applied between clinics as well as within clinics. Given that nearly half of gonorrhoea cases are part of these endemic transmission networks, current practice, which is focused within individual clinics, is unlikely to have a large impact in reducing the incidence of disease. Clinics must therefore work together to identify transmission networks and to ensure that a large proportion of contacts are treated rapidly. In major metropolitan areas such as London, partner notification may not always be possible, for example if the sexual contact is unknown to the patient. Molecular typing, which could potentially be provided to the clinics on a rapid timescale (within 2 weeks of the sample being taken at the clinic), could be used to improve the ascertainment of contacts by identifying potentially linked pairs which can be checked against partner notification records. In addition, it can be used to distinguish between outbreaks (new strains) which may necessitate a more rapid response to limit onward transmission and endemic strains. Furthermore, through continued surveillance of strains over a longer period it will be possible to evaluate the extent to which endemic transmission is being controlled and to identify sectors of the population where enhanced case-finding and further prevention initiatives could help control gonorrhoea.
Acknowledgements
We thank Dr Iona Martin, GRASP laboratory supervisor, for training, advice and technical support, Caroline Murphy and Mariam Perault for technical assistance and the staff of the Microbiology and Genitourinary Medicine Clinics at the collaborating centres. BGS is a Wellcome Trust Principal Research Fellow.
Collaborating Hospitals: Central Middlesex: Dr Shafi, Department of Microbiology, Northwick Park Hospital; Dr Murphy, The Patrick Clements Clinic. Chelsea & Westminster Hospital: Dr Azadian, Department of Microbiology; Dr McLean, Department of GU Medicine, Charing Cross Hospital; Dr McOwan, The Victoria Clinic; Dr Boag, St Stephen’s Centre. Homerton: Dr Karcher, Department of Medical Microbiology; Dr Nathan, Department of Genitourinary Medicine. Kings: Dr Wade, Health Protection Agency South London; Dr Tenant-Flowers, The Caldecot Centre. Royal Free: Dr Kibbler, Department of Microbiology; Dr Ivens, New Marlborough Department of GU Medicine. Royal London: Dr Misfud, Department of Microbiology; Dr Goh, The Ambrose King Centre. St Bartholomew’s: Dr Das, Department of Microbiology; Dr Sarner, Department of GU Medicine. St George’s: Dr Holliman, Department of Medical Microbiology; Dr Hay, Department of GU Medicine. St Mary’s: Dr Jepson, Diagnostic Microbiology; Dr Green, Dept Genitourinary Medicine. St Thomas’: Ms Warren, Department of Microbiology; Dr Rodgers, Department of GU Medicine. UCLH: Mr Prince, Department of Clinical Microbiology, University College London Hospitals; Dr Robinson, Mortimer Market Centre. Whittington: Dr Kelsey, Department of Microbiology; Dr Jungmann, Archway Sexual Health Clinic: Queen Elizabeth Hospital: Dr Bragman and Dr Teal, Department of Microbiology; Dr Russell, Department of GU Medicine.
Funding
This work was funded by the Wellcome Trust (GR072422). The funder played no role in the design or execution of the study.
Footnotes
Ethics Approval
The study data were collected as part of the Gonococcal Resistance to Antimicrobials Surveillance Programme (GRASP) coordinated by the Health Protection Agency for which Multicentre (MREC) and local (LREC) approval was obtained.
Conflict of Interest
Helen Ward is co-Editor and Catherine Ison is an Associate editor of the journal Sexually Transmitted Infections
References
- 1.Health Protection Agency 2007 http://www.hpa.org.uk/infections/topics_az/hiv_and_sti/epidemiology/datatables2005.htm#data.
- 2.Lacey CJ, Merrick DW, Bensley DC, Fairley I. Analysis of the sociodemography of gonorrhoea in Leeds, 1989-93. Bmj. 1997;314(7096):1715–8. doi: 10.1136/bmj.314.7096.1715. [DOI] [PMC free article] [PubMed] [Google Scholar]
- 3.Low N, Sterne JA, Barlow D. Inequalities in rates of gonorrhoea and chlamydia between black ethnic groups in south east London: cross sectional study. Sex Transm Infect. 2001;77(1):15–20. doi: 10.1136/sti.77.1.15. [DOI] [PMC free article] [PubMed] [Google Scholar]
- 4.Monteiro EF, Lacey CJ, Merrick D. The interrelation of demographic and geospatial risk factors between four common sexually transmitted diseases. Sex Transm Infect. 2005;81(1):41–6. doi: 10.1136/sti.2004.009431. [DOI] [PMC free article] [PubMed] [Google Scholar]
- 5.Shahmanesh M, Gayed S, Ashcroft M, Smith R, Roopnarainsingh R, Dunn J, et al. Geomapping of chlamydia and gonorrhoea in Birmingham. Sex Transm Infect. 2000;76(4):268–72. doi: 10.1136/sti.76.4.268. [DOI] [PMC free article] [PubMed] [Google Scholar]
- 6.Choudhury B, Risley CL, Ghani AC, Bishop CJ, Ward H, Fenton KA, et al. Identification of individuals with gonorrhoea within sexual networks: a population-based study. Lancet. 2006;368(9530):139–46. doi: 10.1016/S0140-6736(06)69003-X. [DOI] [PubMed] [Google Scholar]
- 7.Ison CA, Martin IM, London Gonococcal Working Group Susceptibility of gonococci isolated in London to therapeutic antibiotics: establishment of a London surveillance programme. Sex Transm Infect. 1999;75(2):107–11. doi: 10.1136/sti.75.2.107. [DOI] [PMC free article] [PubMed] [Google Scholar]
- 8. http://www.statistics.gov.uk/census2001/census2001.asp.
- 9.Johnson AM, Mercer CH, Erens B, Copas AJ, McManus S, Wellings K, et al. Sexual behaviour in Britain: partnerships, practices, and HIV risk behaviours. Lancet. 2001;358(9296):1835–42. doi: 10.1016/S0140-6736(01)06883-0. [DOI] [PubMed] [Google Scholar]
- 10.Weatherburn P, Reid D, Hickson F, Hammond G, Stephens M. Risk and reflexion: Findings from the United Kingdom Gay Men’s Sex Survey 2004. Sigma Research; London: 2005. [Google Scholar]
- 11.Townsend P, Phillimore P, Beattie A. Health and deprivation: inequality and the North London. Croom Helm; 1988. [Google Scholar]
- 12.Kulldorff M, Nagarwalla N. Spatial disease clusters - detection and inference. Statistics in Medicine. 1995;14:799–810. doi: 10.1002/sim.4780140809. [DOI] [PubMed] [Google Scholar]
- 13.Kerani RP, Handcock MS, Handsfield HH, Holmes KK. Comparative geographic concentrations of 4 sexually transmitted infections. Am J Public Health. 2005;95(2):324–30. doi: 10.2105/AJPH.2003.029413. [DOI] [PMC free article] [PubMed] [Google Scholar]
- 14.Krieger N, Waterman PD, Chen JT, Soobader MJ, Subramanian SV. Monitoring socioeconomic inequalities in sexually transmitted infections, tuberculosis, and violence: geocoding and choice of area-based socioeconomic measures--the public health disparities geocoding project (US) Public Health Rep. 2003;118(3):240–60. doi: 10.1093/phr/118.3.240. [DOI] [PMC free article] [PubMed] [Google Scholar]
- 15.Zenilman JM, Ellish N, Fresia A, Glass G. The geography of sexual partnerships in Baltimore: applications of core theory dynamics using a geographic information system. Sex Transm Dis. 1999;26(2):75–81. doi: 10.1097/00007435-199902000-00002. [DOI] [PubMed] [Google Scholar]
- 16.Rothenberg RB. The geography of gonorrhea. Empirical demonstration of core group transmission. Am J Epidemiol. 1983;117(6):688–94. doi: 10.1093/oxfordjournals.aje.a113602. [DOI] [PubMed] [Google Scholar]