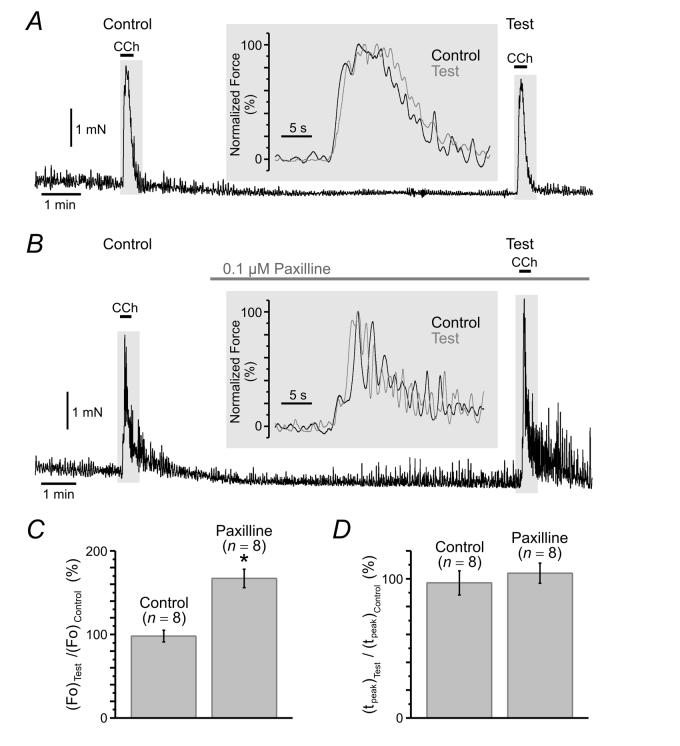
Fig. 10.
Effect of inhibition of BK channels on isometric force of muscarinic contraction. The protocol was similar to that in Fig.9. The Test response to 2 μM CCh was obtained in control (A) and in 0.1 μM paxilline (B). Insets: the overlays of Test (black trace) and Control (grey trace) responses normalised to their maximum are presented on an expanded time scale. The bar diagram plots summarise: (C) relative change in the maximal isometric force ((Fo)Test/(Fo)Control) and (D) relative change in time-to-peak ((tpeak)Test/(tpeak)Control). *Significant (p<0.0008) increase of the maximal cholinergic force following BK channel inhibition was not associated with any significant (p = 0.92) change in the kinetics of the contraction.

