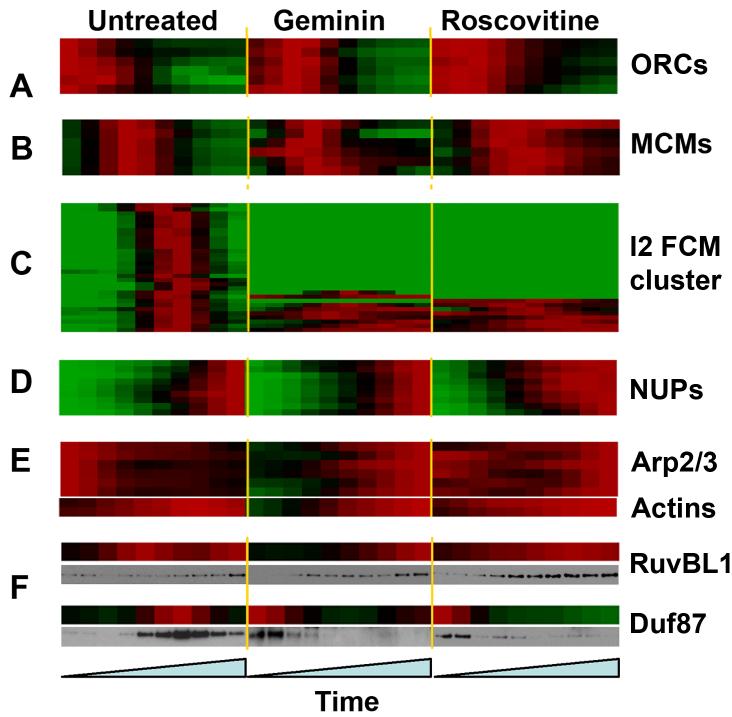
Figure 4.
Hierarchical clustering of the combined data set.
The combined data set was constructed by uniting data from three experimental conditions (inhibitor-free, geminin and roscovitine) for each protein. Selected groups of highly correlated proteins are shown. (F) Chromatin was isolated in parallel to the mass spectrometry samples and immunoblotted for DUF87 and RuvBL1. Colour coding: green 0.0, black 0.5, red 1.0.

