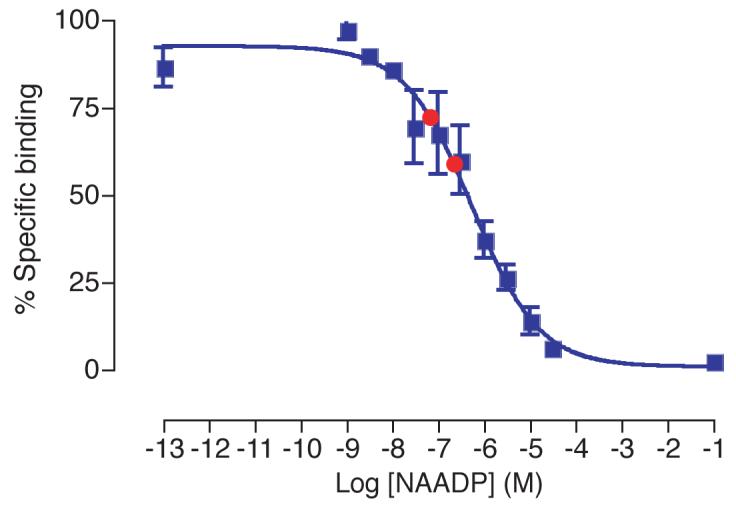
Figure 8.

Displacement curve generated from known NAADP concentrations (blue squares). The difference between known NAADP concentrations spiked into rat brain extract (prepared as described) are correctly detected (red circles). Error bars represent standard error of the mean, n=3.
