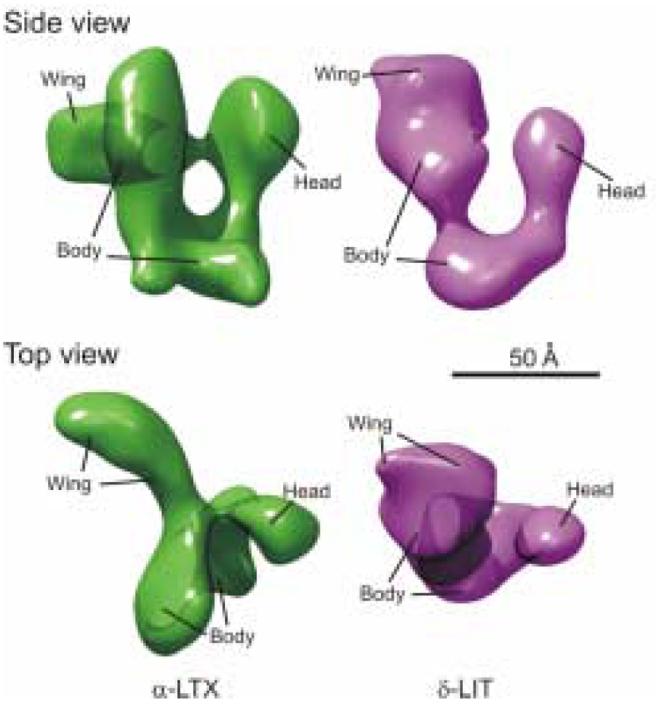
Fig. 2.

The 3D structures of α-LTX and δ-LIT monomers. Comparison of the side and top views of the α-LTX monomer obtained by single-particle analysis of cryo-electron micrographs (Orlova et al., 2000) with similar views of the δ-LIT monomer, reconstructed by single-particle analysis of negative-stain electron micrographs. The domains of α-LTX are marked as in (Orlova et al., 2000); tentative domain assignments in the δ-LIT reconstruction are based on the interactive overlap of the 3D maps, fitting of ARs and volumetric analysis. Both volumes were low-pass filtered to 20 Å. (J. Nield, R. Abbondati, B. Odier, A. Rohou, Y. Ushkaryov; unpublished results).
