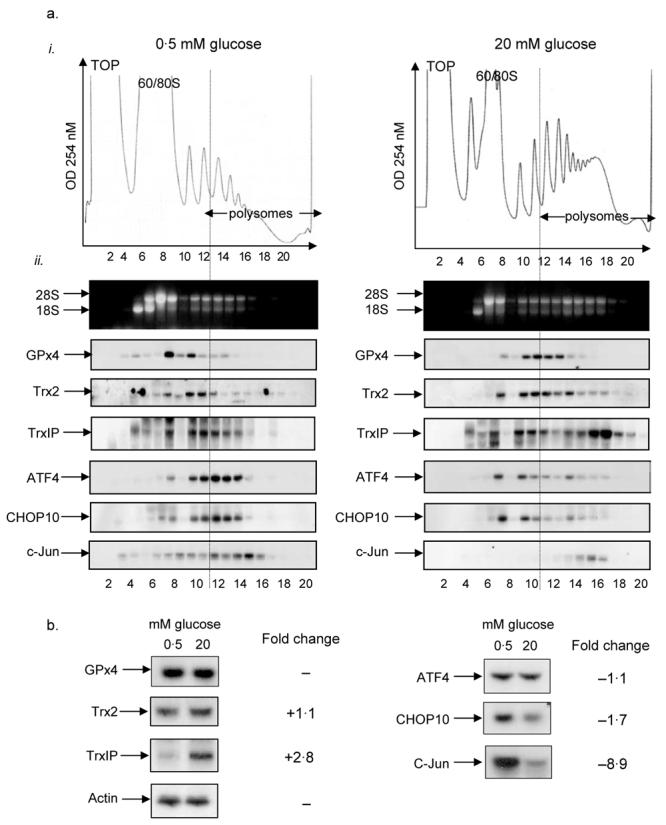
Figure 3.

Polysome analysis of mRNAs associated with oxidative stress. MIN6 cells were pre-incubated in KRB containing 0·5 mM glucose for 1 h followed by incubation in KRB containing 0·5 or 20 mM glucose for a further hour. (a) Cells were lysed and polysome analysis was carried out using 20–50% sucrose gradients. The gradients were fractionated from top (fraction 1) to bottom (fraction 20). (a. i) Absorbance of the gradients was measured continuously at 254 nm to give polysome profiles. (a. ii) RNA was isolated from each fraction and run on 1% agarose formaldehyde gel. RNA was transferred onto nylon membrane and probed for the mRNAs indicated. The results presented are representative of three separate experiments. (b) Cells were lysed and total RNA isolated. The RNA was then run on 1% agarose formaldehyde gel, transferred onto nylon membrane and probed for specific mRNAs as shown. The fold changes observed in the northern blot between low and high glucose concentrations were quantified with ImageJ. The results presented in this figure are representative of three separate experiments.
