
Figure 1.
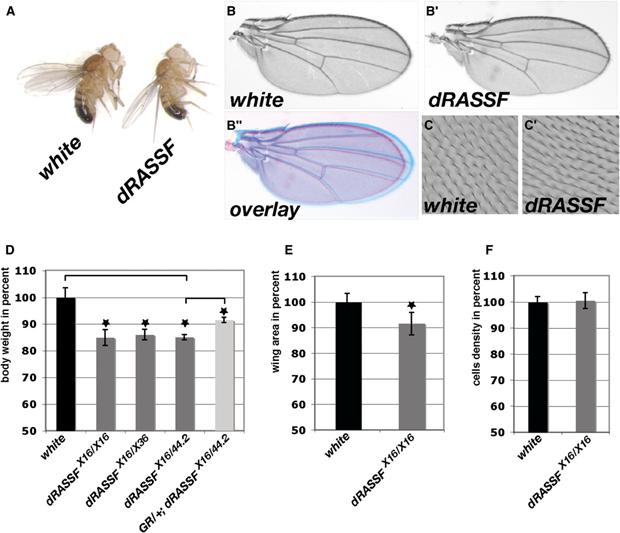
dRASSF Controls Body Size
- (A) white and dRASSFX16/X16 adult flies showing that dRASSF flies present a size defect.
- (B–B″) dRASSFX16/X16 wings (B′) are smaller than white wings (B). (B″) Overlay of B and B′.
- (C and C′) Cell density is not affected in dRASSF wings. Phase-contrast image of wing hairs on the wing surface of white and dRASSFX16/X16 flies. Note identical hair densities, indicating normal cell size in mutant wings.
- (D) Histogram representing fly weights as percent of white control animals. dRASSF flies are 15% smaller than white flies. This weight defect is partially rescued in the presence of the genomic rescue construct (GR). *p < 0.05 (white n = 120, dRASSFX16/X16 n = 120, dRASSFX16/X36 n = 90, dRASSFX16/44.2 n = 90, GR;dRASSFX16/44.2 n = 90).
- (E) Histogram representing wing areas as percent of control (white) wings. dRASSFX16/X16 wings are 8% smaller than control wings. *p < 0.05 (white n = 14, dRASSFX16/X16 n = 11).
- (F) Histogram representing the number of trichomes in a defined wing area (see Supplemental Experimental Procedures) as a percent of control (white). No significant difference was found between control and dRASSFX16/X16 wings (p > 0.05). white, n = 430; dRASSF, n = 432. Error bars correspond to standard deviations.