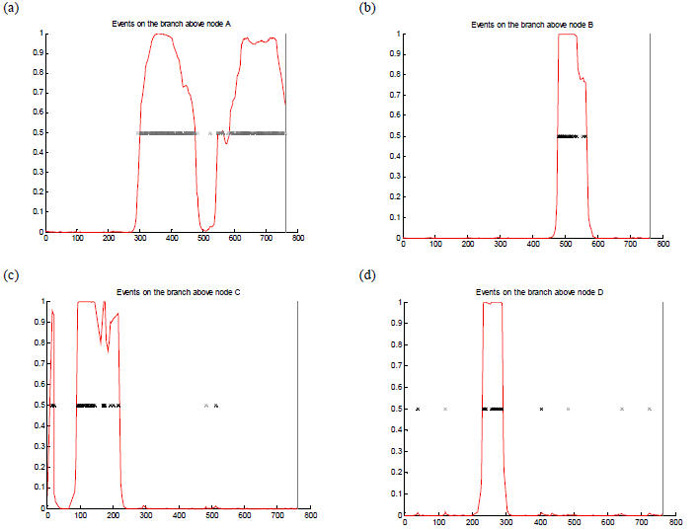
Fig. 3.
Representation of fHbp gene recombination events (a) - (d). The nucleotide sequence of fHbp gene is on the x axis with the red line indicating the probability for an import from 0 to 1 (y axis). The panels depict genetic events above nodes A, B, C and D shown in the 75% majority-rule consensus ClonalFrame tree panel (Fig. 2). Each inferred substitution is indicated by a cross, the intensity of which indicates the posterior probability for that substitution. In panel (a) horizontal genetic exchange is depicted occurring from bases 300 to 500 and 550 to 800; in panel (b) from 450-600; panel (c) horizontal genetic exchange is depicted occurring from bases 100 to 250 and in panel (d) at about 200 and 300 bases.

