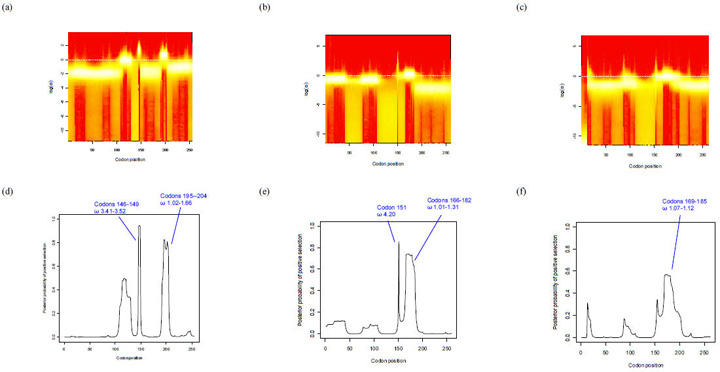
Fig. 4.
OmegaMap program output using subfamily A/variant 2 and subfamily B/variant 1 nucleotide sequences. Panels (a), (b) and (c) depict fireplots of the sitewise posterior distribution of log(ω) for subfamily B, subfamily A (without variant 3) and subfamily A/variant 3 sequences respectively. A fireplot visualizes the posterior on log(ω) along the sequence using a colour gradient where a higher posterior density is represented by more intense colour (closer to white), and lower posterior density is represented by less intense colour (closer to red). Panels (d), (e) and (f) depict the posterior probability of positive selection (y-axis, values 0 to 1) along the codon sequence (x-axis) for subfamily B, subfamily A (without variant 3) and subfamily A/variant 3 sequences respectively. Sites with a point estimate of ω > 1 are indicated with blue braces. Note: Variants 2 and 3 differ from subfamily B/variant 1 in length by +4 and +7 bp respectively e.g. residue 147 of variant 1 is at position 151 of subfamily A/variant 2 (e) and 154 of subfamily A/variant 3 (d).

