
Figure 1.
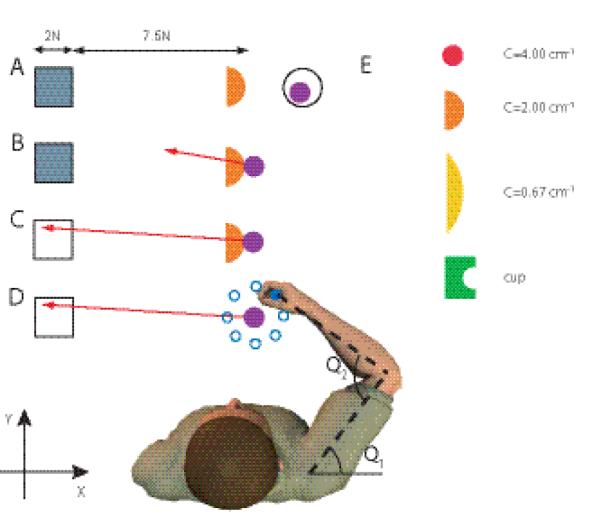
Overview of the experimental setup and paradigm for the main experiment. An additional experiment was carried out with the visual and haptic scene rotated 90 ° clockwise. A, Visual display when the subject is not touching the rigid object. Orange half circle represents a simulated rigid object that is fixed in space. The square is the target area and the purple circle is the veridical representation of the subject’s hand position. The hand is in the start area (black circle). The target area is grey, indicating that the force vector is not in it. B, Subject touches the rigid object and feels the interaction force. The force exerted on the object is shown to the subject as a red arrow. The start area is no longer presented. C, Same as above, but now the force vector is correctly within the target, which becomes white. D, After a 1.5—2.5 s delay the visual display is frozen and the hand is moved 8 mm to one of eight positions around a circle (blue). The visual display, the perturbation positions and the subject are not drawn on the same scale. E, The four objects with which the subjects interact. ‘C’ stands for curvature with unit cm−1. All objects had the same color in the experiment. The Cartesian axes are indicated by x and y and the shoulder and elbow joint angles by θ1 and θ2.