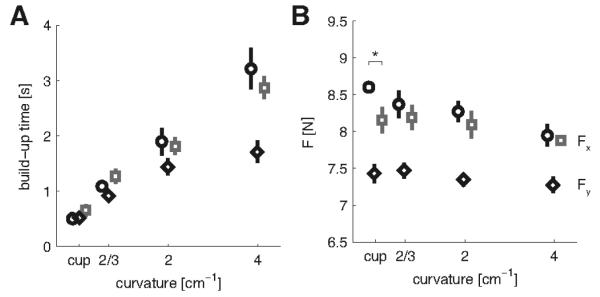
Figure 2.
Task performance. A, The mean time (± sem across subjects) to stabilize the required force. B, The mean force (± sem) exerted in the target region. Circles (black) and squares (grey) indicate the blocked and random session respectively for pushing in the main study: negative-x direction (Fx). Black diamonds refer to pushing in the second study: positive-y direction (Fy), in a blocked design. Measures calculated over the final 40 trials of each condition. * Indicates significant difference between the blocked and random sessions (p<0.05).

