Fig 5.


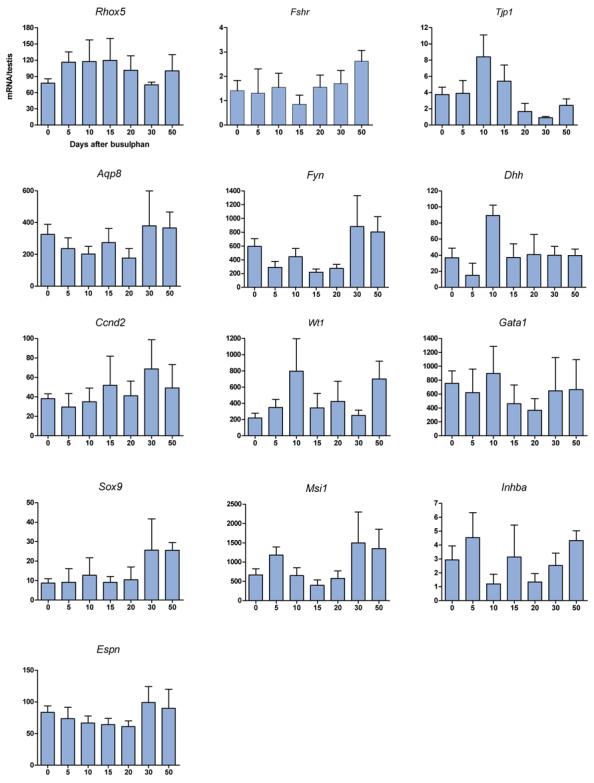
Fig 5A Effect of busulphan treatment on levels of mRNA transcripts encoding markers of Sertoli cell-specific products. Expression was measured by real-time PCR, and results are expressed relative to the external control luciferase. The results are expressed as mean±SEM for four or five animals in each busulphan-treated group and 18 animals in the control group. Transcripts showing no change in levels after busulphan treatment have been grouped here.
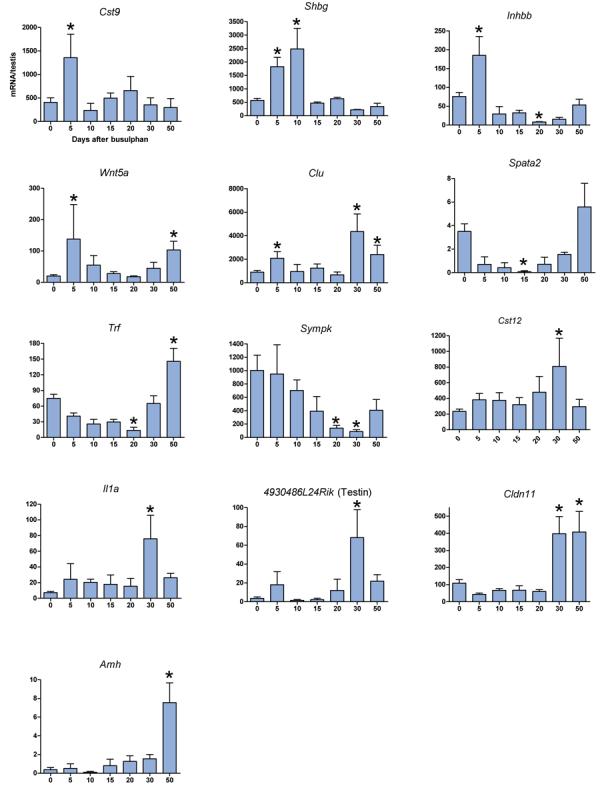
Fig 5B Effect of busulphan treatment on levels of mRNA transcripts encoding markers of Sertoli cell-specific products. Expression was measured by real-time PCR, and results are expressed relative to the external control luciferase. The results are expressed as mean±SEM for four or five animals in each busulphan-treated group and 18 animals in the control group. Transcripts showing a significant difference to control values (P<0.05, marked *) have been grouped here and are ordered according to the time at which an effect of busulphan is first seen.
