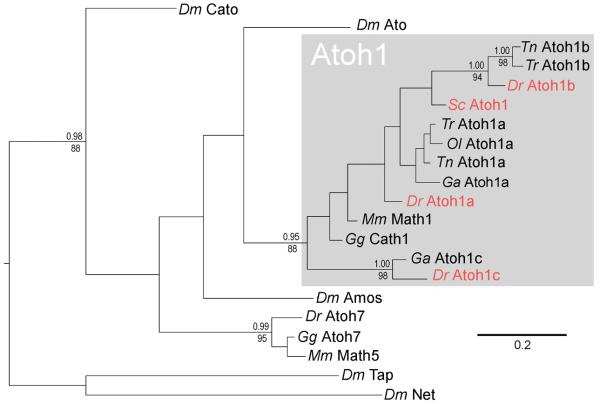
FIGURE 6. Phylogenetic relationships of vertebrate atonal genes.
The phylogenetic tree shown was derived by Bayesian analysis of the aligned bHLH region and is rooted with the Drosophila bHLH genes tap and net. A very similar topography was also recovered using maximum likelihood reconstruction. Support values above nodes represent Bayesian posterior probabilities and those below nodes represent bootstrap percentages of 1000 pseudoreplicates. Values are given for all nodes that were significantly supported in both analyses (pp > 0.95 and bs> 70). Genes shown in red are examined in this study. Dm – Drosophila melanogaster, Dr – Danio rerio, Ga - Gasterosteus aculeatus, Gg – Gallus gallus, Mm – Mus musculus, Ol - Oryzias latipes, Sc – Scyliorhinus canicula, Tn - Tetraodon nigroviridis, Tr – Takifugu rubripes.

