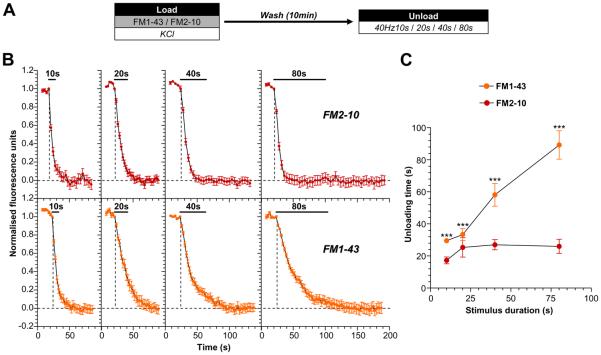
Figure 1. ADBE provides additional SVs for the total SV recycling pool.
A, Cultures were loaded with either 10 μM FM1-43 or 100 μM FM2-10 in the presence of elevated KCl (50 mM) for 2 min. Dyes were washed away immediately after stimulation and cultures were left to rest for 10 min. Dye unloading was stimulated by trains of action potentials (either 10s, 20s, 40s, or 80s) at 40 Hz. B, Representative traces of the time course of dye unloading in response to action potentials are displayed (FM2-10 - red symbols, top; FM1-43 - orange symbols, bottom). The duration of unloading stimulation is represented by bars. Data are normalised between 1 and 0 in all instances, where 1 = start of stimulation and 0 = cessation of unloading (indicated by dotted lines). C, The mean unloading time for either dye is plotted against the stimulus duration (FM2-10 - red symbols; FM1-43 - orange symbols). All n = 4 experiments (except 40 Hz 10s FM1-43 and 40 Hz 80s FM1-43, n = 3) ± SEM, *** p<0.001, two-way ANOVA.

