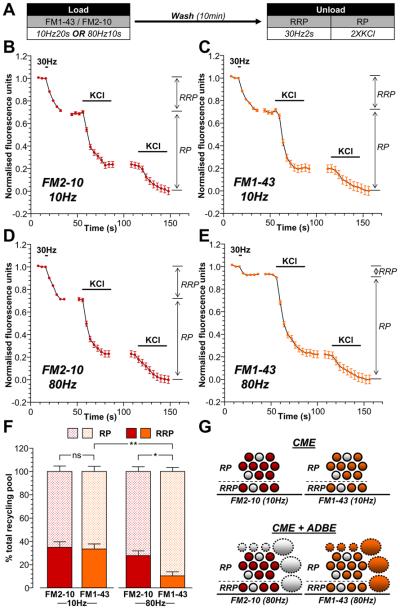
Figure 2. ADBE preferentially refills the SV reserve pool.
A, Cultures were loaded with either 10 μM FM1-43 or 100 μM FM2-10 using trains of either 200 action potentials (10 Hz) or 800 action potentials (80 Hz). Dyes were washed away immediately after stimulation and cultures were left to rest for 10 min. The RRP was unloaded with 60 action potentials (30 Hz) and the reserve pool (RP) was unloaded with two 30 second applications of 50 mM KCl. B - E, Representative traces of the average fluorescence drop of nerve terminals loaded with either 200 action potentials are shown (10 Hz; B - FM2-10, C - FM1-43) or 800 action potentials (80 Hz; D - FM2-10, E - FM1-43). Unloading stimulations are represented by bars. Traces were normalised (between 1 and 0) to the size of the recycling pool (RRP + RP) for each nerve terminal. The relative size of the RRP and RP are indicated by arrows. F, Average proportion of the RRP and RP as a percentage of the SV recycling pool is shown (FM2-10 – red bars; FM1-43 – orange bars; RRP - solid bars; RP – dotted bars). All experiments n = 4 (except 10 Hz FM2-10 and 80 Hz FM1-43, n = 3) ± SEM, * p<0.05, ** p<0.01, for both RRP and RP, one-way ANOVA. G, Schematic diagrams illustrating the extent of RRP and RP replenishment by SVs loaded with either FM2-10 (left, red) or FM1-43 (right, orange) using either 10 Hz stimulation (top, only triggers CME) or 80 Hz stimulation (bottom, triggers both CME and ADBE). Solid circles represent dye-loaded SVs, clear circles represent non-loaded SVs. Solid ovals represent dye-loaded endosomes, clear ovals represent non-loaded endosomes. Solid outlines represent CME-generated structures, dotted outlines represent ADBE-generated structures.

