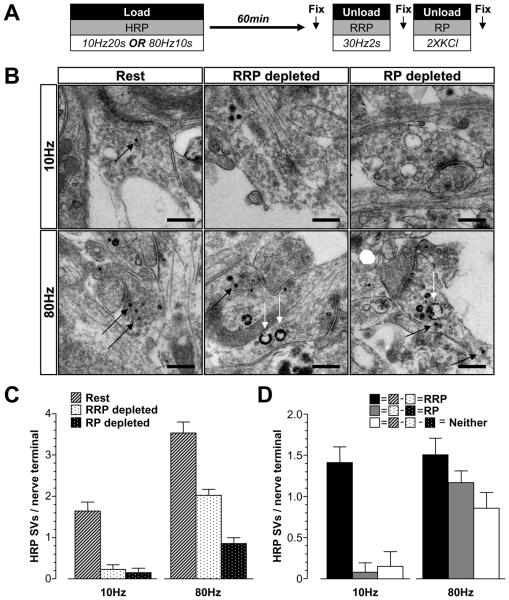
Figure 6. Replenishment of SV pools visualised by electron microscopy.
A, Cultures were loaded with 10 mg/ml HRP using either trains of 200 action potentials (10 Hz) or 800 action potentials (80 Hz). HRP was washed away immediately after stimulation and cells were left to rest for 60 min. The RRP was unloaded with 60 action potentials (30 Hz) and the reserve pool (RP) was unloaded with two 30 second applications of 50 mM KCl. Cells were fixed at 3 different time points indicated by arrows (Rest, after RRP depletion and after RP depletion) and processed for electron microscopy. B, Representative electron micrographs display nerve terminals that were subjected to the treatments described above. Black arrows indicate HRP-labelled SVs, white arrows indicate HRP-labelled endosomes (scale bar - 500 nm). C, HRP-labelled SVs were counted and divided by the number of nerve terminals analysed (Rest – hatched bars; RRP depleted – black dots on white bars; RP depleted – white dots on black bars). D, The size of the RRP (Rest minus RRP depleted), RP (RRP depleted minus RP depleted), and a SV population belonging to neither (Rest minus both RRP depleted and RP depleted) were calculated and presented as HRP-labelled SVs per nerve terminal. Data in C and D are averages pooled from individual nerve terminals from the same experiment (10 Hz; Rest n = 56 nerve terminals, RRP depleted n = 26, RP depleted n = 20: 80 Hz; Rest n = 75, RRP depleted n = 112, RP depleted n = 49; all ± SEM).

