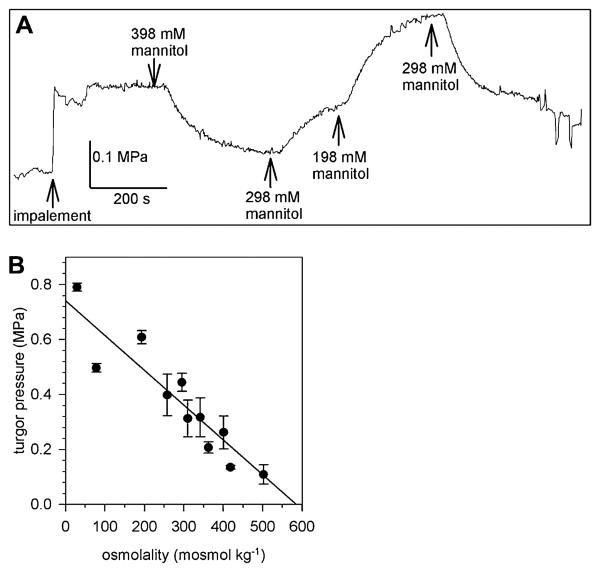
Figure 1.
Turgor pressure of PGs. A, A lily PG was impaled with the pressure probe in standard medium (298 mM mannitol). Perfusion of the chamber with hyper- (398 mM mannitol) and hypoosmolar (198 mM mannitol) media resulted in a reversible change of turgor pressure. At the end of the turgor pressure measurement, small pressure changes were induced and the corresponding volume of the PG measured to determine the elastic modulus ε. B, The measured turgor pressure plotted against the osmolality of the bath medium (n > 8 individual PGs) showing a linear osmotic behavior of lily PGs. Mean values ± sd.

