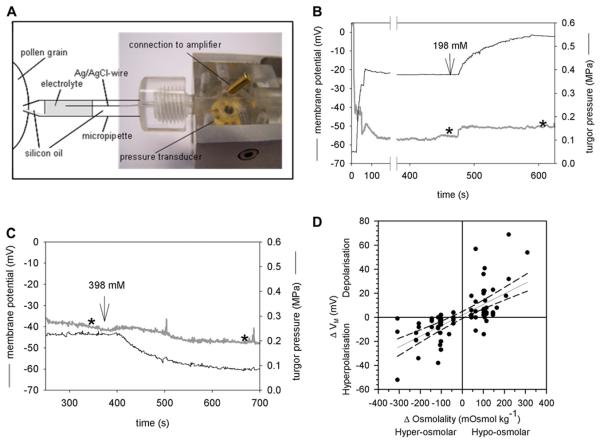
Figure 2.
Simultaneous measurement of turgor pressure and membrane potential in single PGs. A, Modified pressure probe with a chlorided silver wire reaching into the electrolyte solution. Except for the indicated part of the micropipette, the pressure probe as well as the other parts of the micropipette was filled with silicon oil. B, Typical recording of the turgor pressure (black) and membrane potential VM (gray). A change from iso- to hypoosmolar medium (198 mM mannitol) increased the turgor pressure and depolarized the PM whereas a change to hyperosmolar medium (398 mM mannitol) led to a hyperpolarization of the PM (C). Stars indicate the time at which the data were used to create Figure 2D. D, Summary of all PGs in which turgor pressure and VM were measured simultaneously. Hyperpolarization of the PM upon hyperosmolar treatments are given as negative ΔVM and Δosmolality values, respectively. A regression line with the 95% confidence intervals (dashed line) was fitted to the data. [See online article for color version of this figure.]

