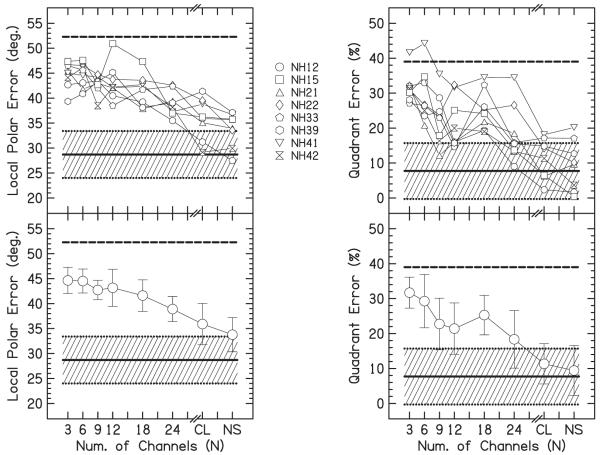
FIG. 3.
Results of experiment 1. The upper panels show the individual data. The lower panels show the listener average and ±1 standard deviation. The left column shows the local polar error in degrees as a function of the number of channels. The right column shows the percentage of quadrant errors. Results for the WB clicks (CL) and WB noises (NS) are also included. The dashed lines show chance performance. The shaded area shows the average (solid line) and ±1 standard deviation (dotted lines) of the results from Middlebrooks (1999b) for virtual WB noise stimuli.

