
Figure 2.
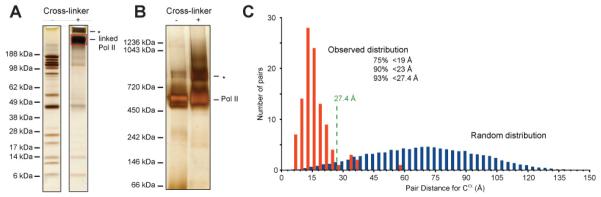
Benchmarking the cross-linking/mass spectrometry process using S. cerevisiae RNA polymerase II (Pol II) and its crystal structure. (A) The subunits of Pol II are separated by denaturating gel electrophoresis (SDS PAGE) and visualized by silver staining. The individual subunits can be seen as separate bands before the addition of cross-linker (here Bis(Sulfosuccinimidyl) suberate (BS3)). After cross-linking, these individual bands disappear and a new, high-molecular weight band appears, corresponding to the cross-linked Pol II (red box). A higher molecular weight band corresponds possibly to Pol II dimers (asterisk). (B) Pol II migrates under native conditions mostly as a single band, both in the absence and presence of cross-linking. Under both conditions, some Pol II dimerization is observed (asterisk). (C) Distribution of alpha-carbon distances for lysine pairs in the crystal structure of Pol II (PDB 1WCM) (Armache et al., 2005) when scaling the distance distribution for all random lysine pairs in the crystal structure to 106 pairs (blue) and when taking the distance measure of those 106 pairs that were observed by cross-linking (red) (Chen et al., 2010). The predicted upper limit for cross-linkable lysine pairs in the crystal structure is here 27.4 Angstrom. This upper limit includes the length of lysine side chains (2 × 6.5 Angstrom), the length of the spacer (max. 11.4 Angstrom) and an estimation of the positional error in the crystal structure (1.5 Angstrom for surface residues). The upper limit does not consider the possibility of conformation changes or vibrations of the complex in solution. The observed distribution of cross-linked pairs is clearly not random and fulfils largely the theoretically predicted distance threshold for cross-linkable pairs. (all adapted from (Chen et al., 2010))