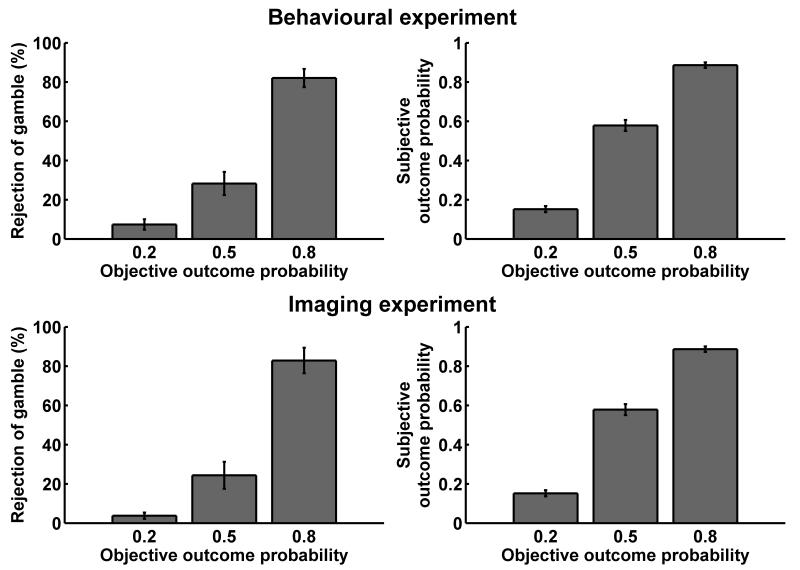
Figure 2.
In a preceding learning task consisting of 144 trials, participants learned the outcome probabilities of the three coloured balls. Choices for the last 24 balanced trials of this part are shown on the left. After the experiment proper, participants were asked for explicit estimates of the outcome probabilities of the three coloured balls, as shown on the right. All results are mean ± standard error for participants that were included into the analysis (behavioural experiment: N = 24, imaging experiment, N = 20). Participants whose choice proportions and subjective probability estimates did not monotonically vary with outcome probability were excluded from scanning/analysis.

