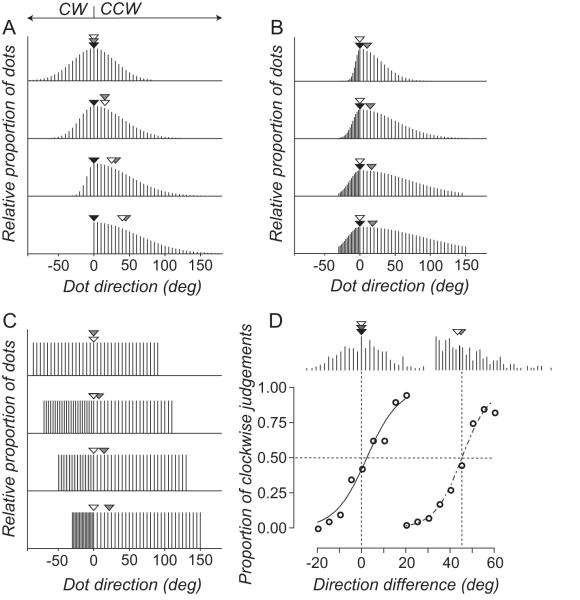
Figure 2.
(A-C) Distributions of dot directions for different comparison RDKs. Arrows show the median (white), vector average (gray) and modal (black) direction of the comparison RDKs. (D) Directions sampled with replacement from the comparison distributions shown in the top and bottom panels of (A). When the comparison distribution is symmetrical the perceived direction of the standard RDKs aligns with the three measures of central tendency of the comparison RDK. When the comparison distribution is asymmetrical only the vector average direction aligns with the perceived direction of the standard RDK The smooth lines through the data points are the best fitting solutions to Equation 1.

