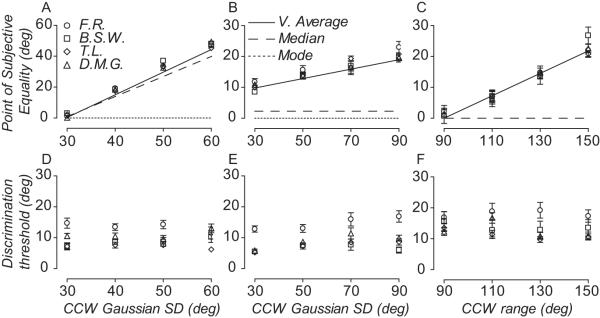
Figure 3.
Vector average of direction distributions accumulated over time predicts the temporal pooling of local motion directions. (A-C) Symbols show the perceived direction of four observers as a function of different comparison distributions. Lines show the temporal vector average (solid), median (dashed) and modal (dotted) direction of the comparison distribution. (B) Note the median direction has been offset from the mode to reduce clutter. (D-F) Symbols show the direction discrimination thresholds of four observers as a function of different comparison distributions. Error bars are 95% CI.

