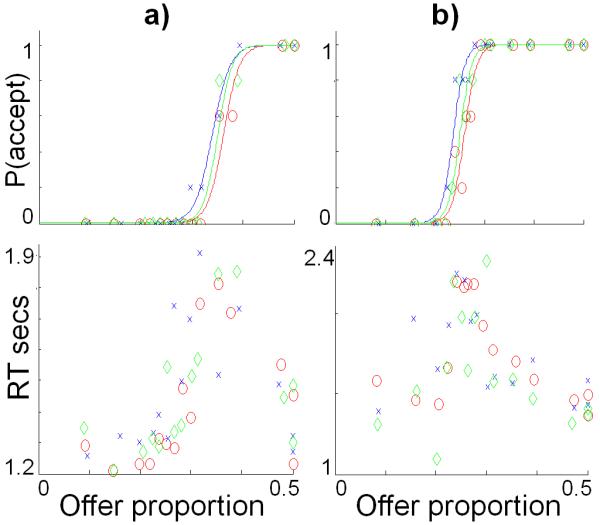
Figure 3. Psychometric analysis of individual subject data.

Data from the scanning session is shown for two exemplar subjects (a and b). For each subject the upper panels show the probability of acceptance and the lower panels show reaction times (RTs), both plotted against offer proportion (each data point being the mean of five trials). Data is shown for the “M” offers in the three contexts: M-alone (green; “neutral”); M-in-L (blue; “more fair”); and M-in-H (red; “less fair”). The upper panels also show probability of acceptance as a logistic function fitted to those points, demonstrating a contextual bias evident in a shift to the left for contextually more fair (M-in-L) and a shift to the right for the less fair (M-in-H) relative to the control condition (M-alone). In the lower panels it can be seen that the point of indifference (probability of acceptance is 0.5) corresponds to peak RTs, consistent with choice difficulty being greatest at this point and arguing against either acceptance or rejection as being a “default” choice.
