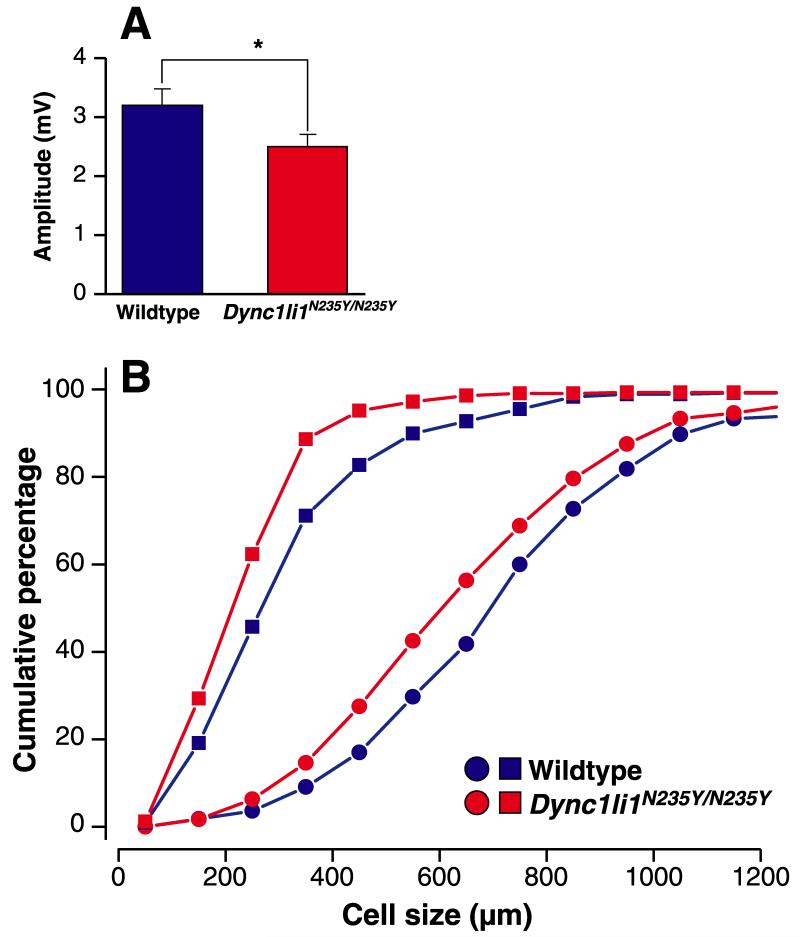
Figure 5. Neurophysiological and histological analysis of Dync1li1N235Y/N235Y mice.
A, Dync1li1N235Y/N235 have mice a significant reduction of the peak-to-peak amplitude of A-fibre compound action potential in the saphenous nerve compared to wildtype littermates. B, QSum plots of the neuronal profile area distribution of neurofilament immunoreactive neurons (giving rise to large myelinated A-fibres; round symbols) and of peripherin immunoreactive cells (giving rise to C-fibres, square symbols) in lumbar dorsal root ganglia. The cell profile size in both populations is reduced in Dync1li1N235Y/N235Y mice compared to wildtype littermates.

