Figure 1.
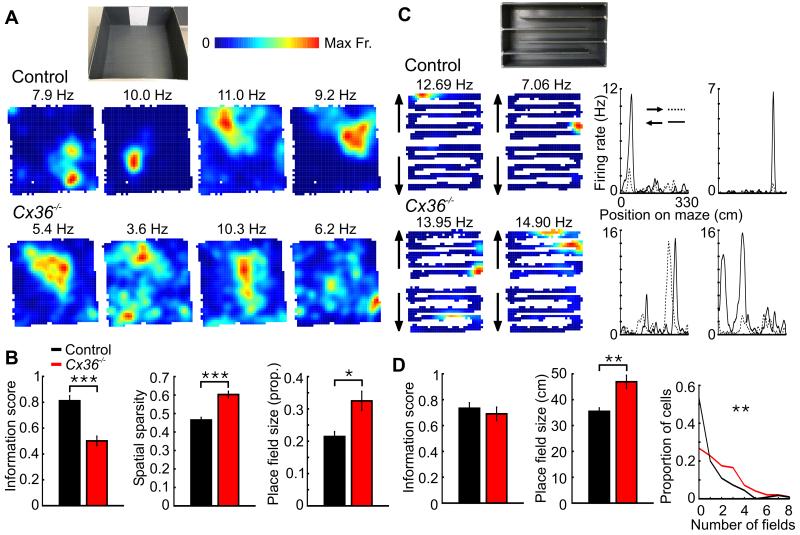
Impaired spatial representations in Cx36−/− mice during open-field exploration and zigzag maze running. A, Four place firing rate maps of pyramidal cells recorded during open-field exploration in a control (top) and Cx36−/− mouse (bottom). The number above each map indicates the maximum firing rate in the map. The picture above shows the 70 × 70 cm open field in which the place cells were recorded. B, Spatial information, spatial sparsity and place field size as a proportion of the open-field area for pyramidal cells of control and Cx36−/− mice. C, Left: Place firing rate maps of pyramidal cells of a control and a Cx36−/− mouse recorded as the mouse ran on the zigzag maze. The firing maps are plotted separately according to the running direction of the mouse (upward or downward). Right: Linear firing maps for the same pyramidal cells as the mouse ran on the zigzag maze. The filled and dotted lines represent the firing rate of the neurons as the mouse ran towards the two different ends of the track. D, Spatial information, linear place field size and mean number of fields per pyramidal cell in control and Cx36−/− mice. *: p < 0.05, **: p < 0.01, ***: p < 10−10.

