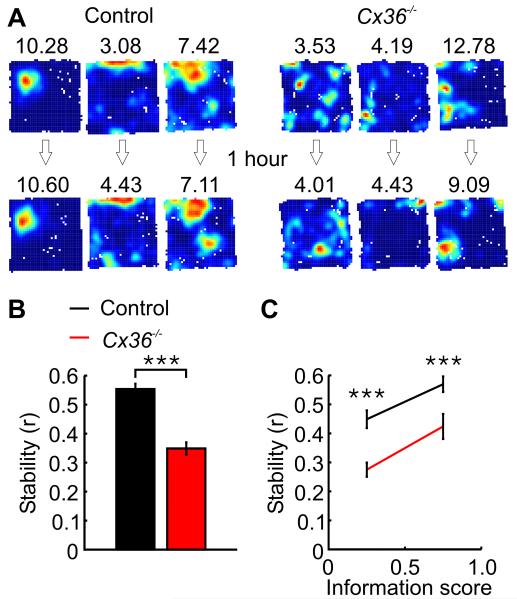
Figure 2.
Impaired stability of spatial representations in Cx36−/− mice during open-field exploration. A, Three place firing rate maps of pyramidal cells recorded during two trials in control (left) and Cx36−/− mice (right). The first trial is shown in the top row. The inter-trial interval was 1 hour long. The number above each map indicates the maximum firing rate in the map. B, Mean spatial stability for pyramidal cells of control and Cx36−/− mice. C, Mean spatial stability for pyramidal cells with an information score of 0-0.5 or 0.5-1. Data are shown separately for both genotypes. ***: p < 10−9.

