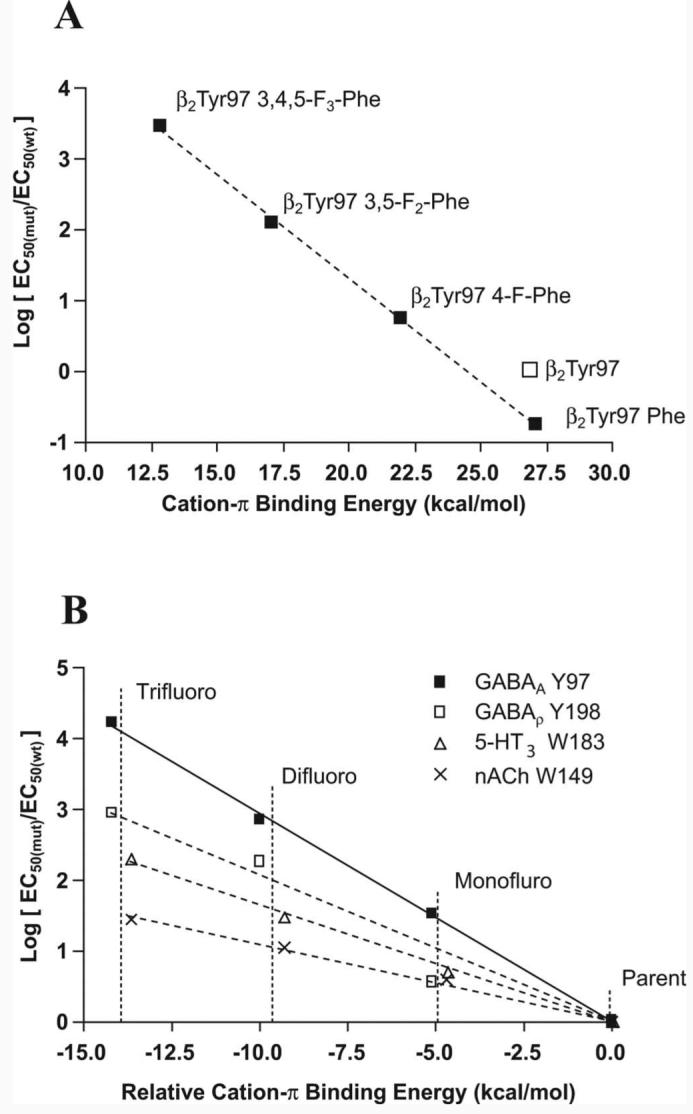
Figure 5.

Fluorination plots. A, Plot of the β2Tyr97 mutant logEC50 values from Table 3 normalized to the wild-type logEC50 and fit by a line of best fit. B, Comparison of the cation–π interactions of the nACh, 5-HT3, GABAC, and GABAA receptors. The x-axis is offset so that the parent, nonfluorinated amino acid (Trp for nACh and 5-HT3 and Phe for GABAC and GABAA) is given a value of zero. The actual values are 32.6 kcal/mol for Trp and 26.9 kcal/mol for Phe. The values are fitted by a line of best fit to aid comparison. The gradient for the MOD-1 receptor is almost identical with that for 5-HT3 and so is removed here for clarity.
