
Figure 1.
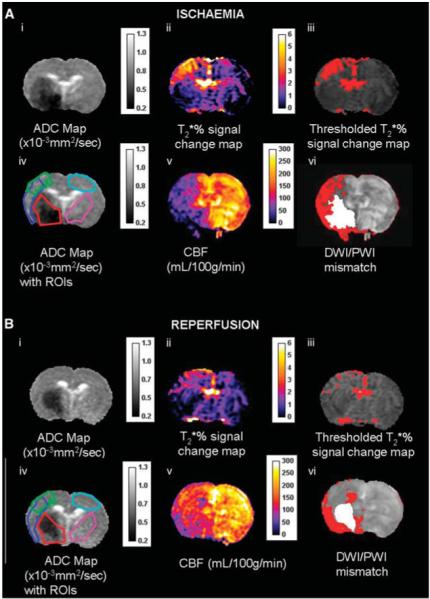
(A) Ischemia scan series and (B) post-reperfusion scan series, with regions of interest (ROIs) superimposed on the apparent diffusion coefficient (ADC) maps (images Aiv and Biv); (ii) oxygen challenge (OC) percentage signal change map, (iii) thresholded OC map, (v) cerebral blood flow (CBF) map (mL per 100 g per minute), and (vi) DWI/PWI overlay (mismatch tissue shown in red). ROIs were defined as follows: green ROI—the penumbra was defined by applying a threshold to display the greatest percentage signal change excluding veins and ventricles (iii). Red ROI—ischemic core within the caudate nucleus, derived from the ADC lesion (i). Sky blue ROI—the contralateral cortex, equivalent to OC-defined penumbra. Cerise ROI—the contralateral caudate nucleus, equivalent to the ADC-derived lesion. Dark blue ROI— DWI/PWI mismatch (vi) derived from the thresholded ADC (i) and CBF maps (v).