
Figure 2.
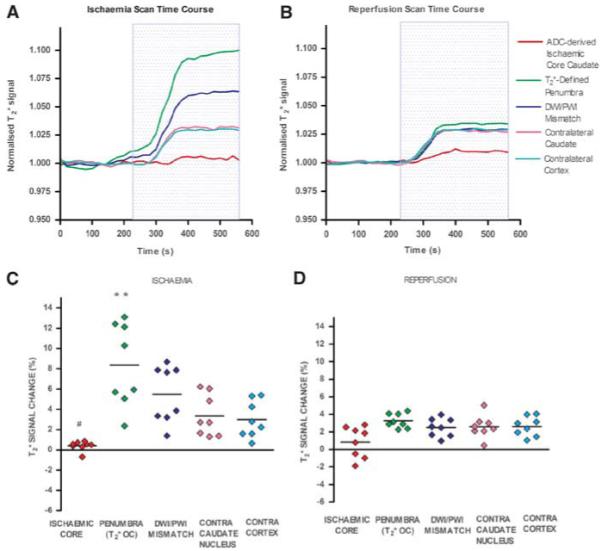
Echo planar imaging (EPI) signal time course during ischemia (A), and following reperfusion (B), mean percentage signal change from baseline for regions of interest (ROIs) during ischemia (C) and following reperfusion (D). (A, B) Positive signal changes were recorded during oxygen challenge (OC) in contralateral caudate nucleus and cortex, the DWI/PWI mismatch, and the OC-defined penumbra. All data were normalized to the average signal over the 4 minutes before OC from eight animals. The blue box represents the period of 100% oxygen inhalation (OC). (C, D) Horizontal lines represent means. **P < 0.01, relative to contralateral cortex ROI. #P < 0.05, relative to contralateral caudate nucleus.