
Figure 4.
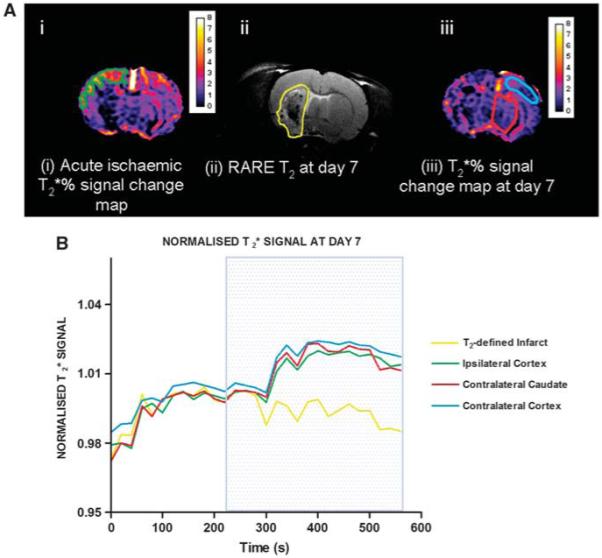
percentage signal change at day 1 and day 7 in selected regions of interest (ROIs). (A) MRI ROIs derived from (i) acute percentage signal change maps during ischemia (ipsilateral cortex penumbra—green); (ii) RARE T2 scans at day 7 after stroke (infarct ROI-yellow); and (iii) percentage signal change maps at day 7 (contralateral cortex and caudate—sky blue and red, respectively). ROIs were superimposed onto day 7 percentage signal change maps generated 7 days after stroke to generate EPI signal time course graphs (B). Traces represent the mean normalized signal from four animals. All data were normalized to the average signal over the 4 minutes before oxygen challenge. Blue box represents period of 100% oxygen inhalation.