
Figure 5.
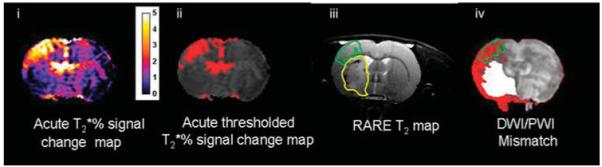
Comparison of neuroanatomical location of thresholded oxygen challenge (OC)-defined penumbra in relation to T2-defined final infarct and DWI/PWI mismatch. Acute percentage signal change map (i) was thresholded to identify penumbra (ii) and superimposed upon the day 7 RARE T2 (iii)—penumbra outlined in green. The final infarct is outlined in yellow. The OC penumbra region of interest (ROI) was superimposed upon the DWI/PWI mismatch (iv) to compare the difference in the spatial locations of the mismatch and the OC defined penumbra.