Figure 1.
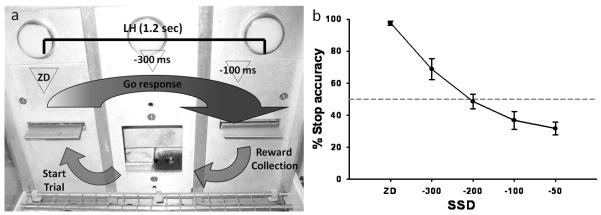
a) Schematic illustration of the SST structure. A standard session consists of 210 trials to be completed within 30 minutes. On go trials (80 % of total trials) the left and right levers have to be pressed in rapid sequence within the duration of the limited hold (LH; 1.2 sec) in order to receive a reward, which is delivered in the central food well. On the remaining 20 % of the trials (stop trials), an auditory stop-signal will be played after the left lever has been pressed and after a variable stop-signal delay (SSD), which is calculated from each rat’s go mean reaction time (mRT): zero delay (ZD), mRT −300 and mRT −100 ms. The presentation of the stop-signal instructs the animal that the ongoing response to the right lever has to be inhibited in order to obtain the reward. Triangles represent the approximate time of presentation of the stop-signal during the go response. b) Representative inhibition function obtained by plotting the SSDs against the probability of successful response inhibition. SSDs for the experimental phase (−300 and −100 ms) are chosen from the central part of the inhibition function, which is the most informative part both empirically and theoretically (Logan, 1994; Band et al., 2003).

