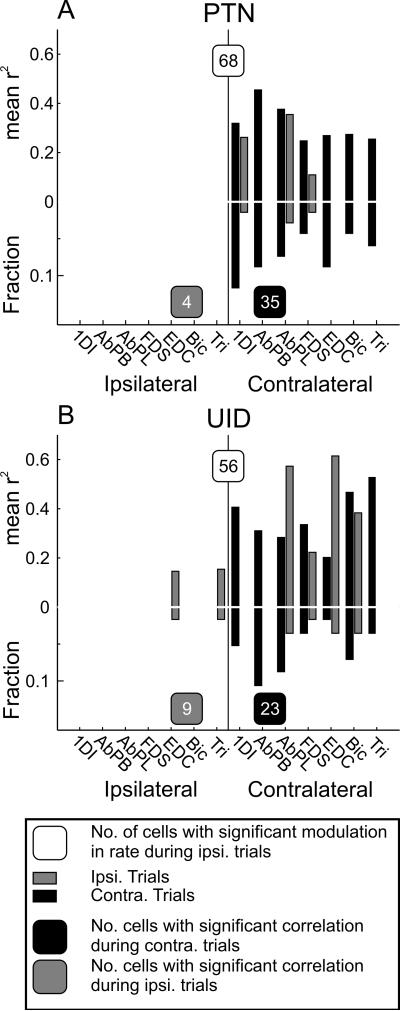
Figure 8. Population results for latency correlation analysis.
For this analysis only cells that showed a significant modulation with ipsilateral trials were considered. In cases where the cell had a significant correlation with multiple muscles, the one with the strongest correlation was used for this plot. A. Mean peak correlation coefficients per muscle for PTNs showing a significant correlation with EMG. Black bars are for contralateral trials and grey bars are for ipsilateral trials. Upward going bars show correlation coefficients, downward going bas the proportion of cells with best correlation with that muscle. For both ipsilateral and contralateral trials, maximal correlations were with contralateral muscles. The numbers in the shaded boxes indicate how many cells showed a significant correlation with EMG during trials of the particular laterality. B, same as A but for unidentified cells (UIDs).

