
Figure 4.
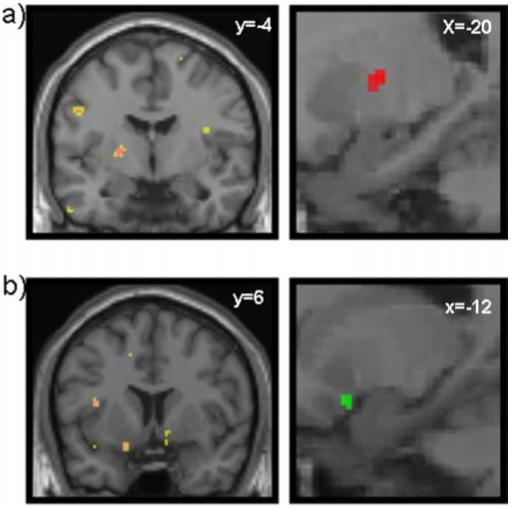
fMRI temporal difference (TD) model. a, Left, Aversive TD error, right mid striatum [Montreal Neurological Institute (MNI) coordinates (x, y, z): −20, −4, 6; z = 3.89; p < 0.005; 21 voxels]. Yellow corresponds to p < 0.005; magenta corresponds to p < 0.001. Right, The image is also shown in sagittal section (in red). b, Left, Appetitive TD error, right ventral striatum (nucleus accumbens) [MNI coordinates (x, y, z): 10, 6, −1; z = 3.13; shown at p < 0.005; 15 voxels] and left ventral striatum (nucleus accumbens) [MNI coordinates (x, y, z): −12, 6, −18; z = 3.62; 14 voxels]. Yellow corresponds to p < 0.005; magenta corresponds to p < 0.001. Right, The image is also shown in sagittal section (in green).