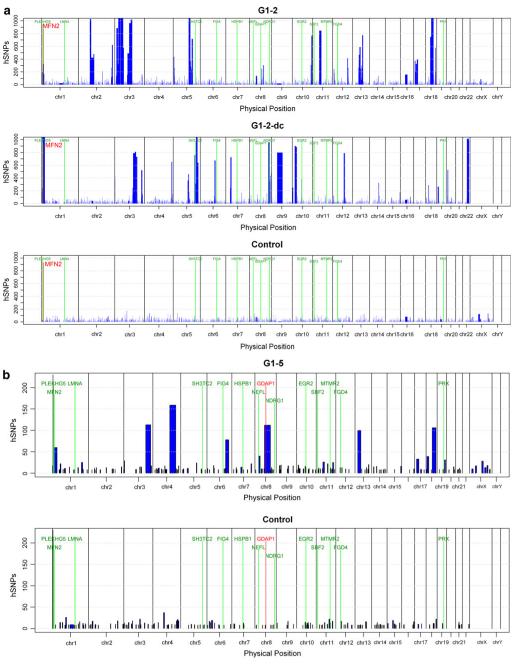
Fig. 3.
Homozygosity profiles. Homozygosity profiles of selected individuals. The intervals of homozygosity are shown as (blue blocks) and are plotted across the genome for each individual. The chromosomal positions of the homozygous intervals are indicated on the x-axis, the length of each block represents the size of the homozygous interval in basepairs (bp). The y-axis shows the number of homozygous SNPs (hSNPs). The physical positions of the known ARCMT genes are included and shown in green color. a High-density (250 K Nsp) array-derived homozygosity profiles of G1-2 and a distantly related cousin (G1-2-dc) (MFN2 marked in red) compared to a control individual with no parental consanguinity. b Low-density (10 K 2.0) array-derived homozygosity profiles for probands G1-5, carrying distinct GDAP1 mutations each (marked in red) and for a control sample

