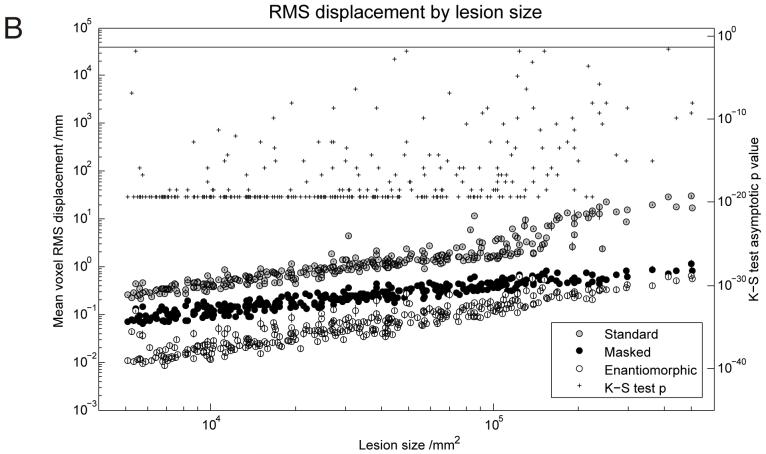
Figure 5B. RMS displacement by lesion size (T1 dataset with zero-filled lesions).
The left hand axis shows whole brain mean voxel RMS displacement with standard errors, plotted by lesions size. The means include all 42 subjects and were derived—owing to log-normality—by first log-transforming the data, calculating the means and standard errors and anti-logging the results. The right hand side shows the asymptotic p values from a one-tailed, two sample Kolmogorov-Smirnov test carried out on the untransformed data from the masked and the enantiomorphic methods. The vertical line at the top defines the 0.05 significance level.

